Free Access
Fig. 6
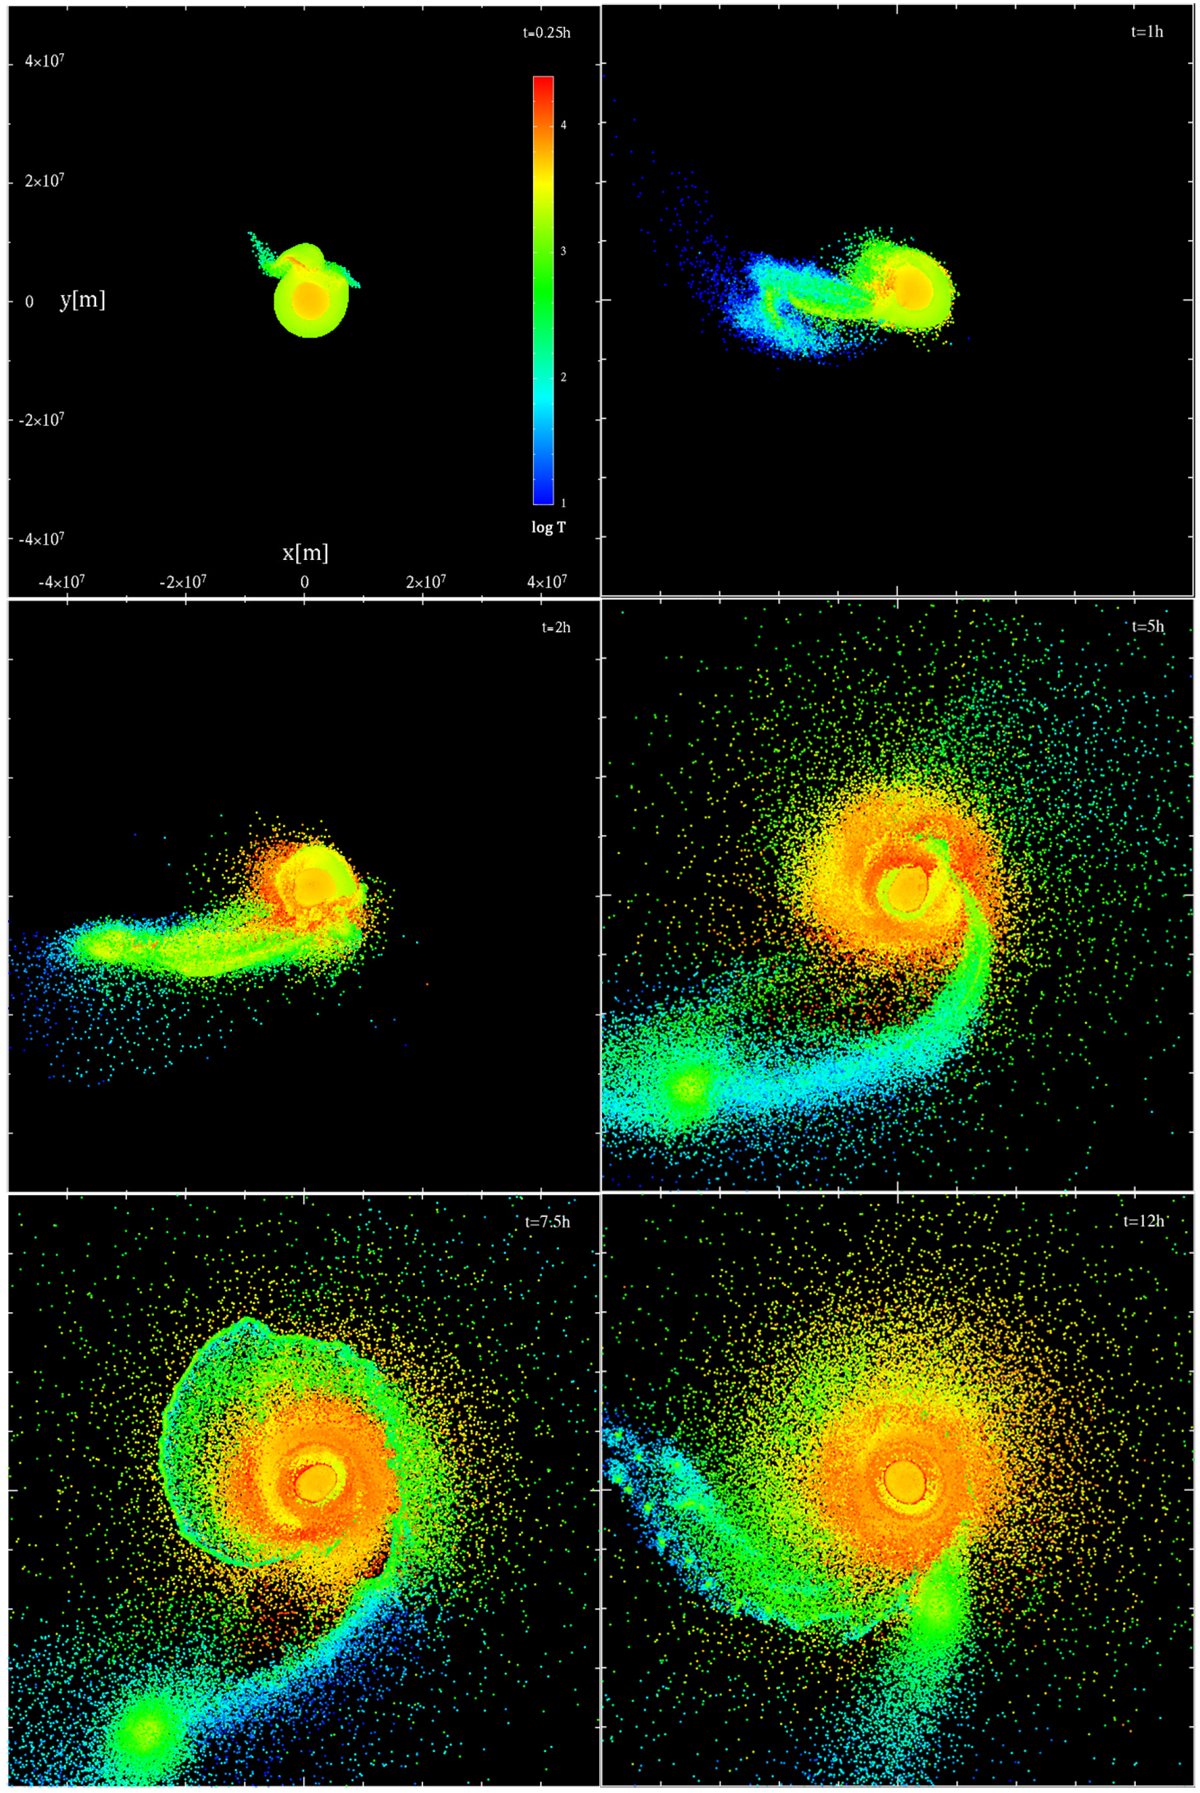
Top-down view of the evolution of the collision for the Hrc1Solid simulation. The temperature range and spatial range can be seen in the top left figure. The times when each of the images were captured, starting from the upper left, are t = 0.25, 1, 2, 5, 7.5, 12 h.
Current usage metrics show cumulative count of Article Views (full-text article views including HTML views, PDF and ePub downloads, according to the available data) and Abstracts Views on Vision4Press platform.
Data correspond to usage on the plateform after 2015. The current usage metrics is available 48-96 hours after online publication and is updated daily on week days.
Initial download of the metrics may take a while.