Fig. 3
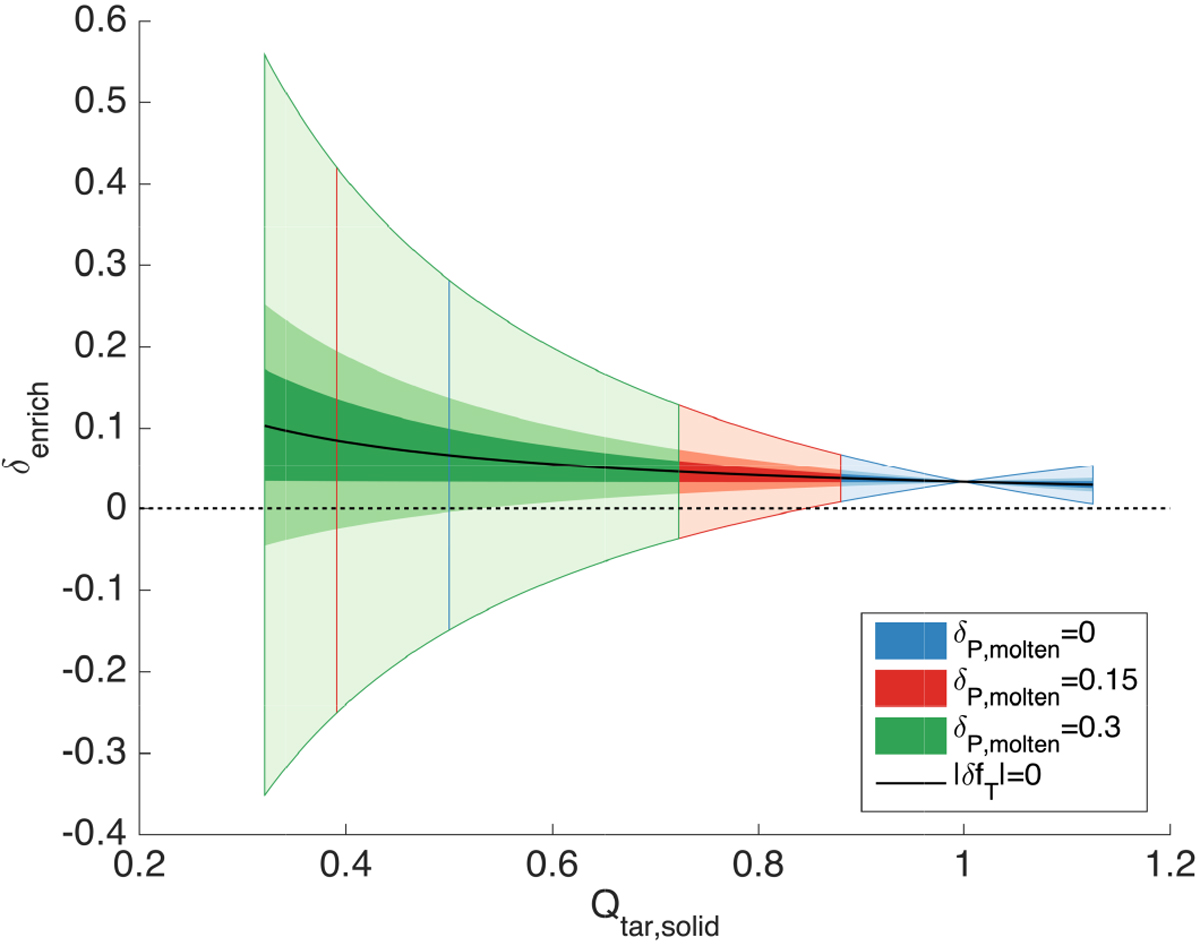
Result of the compositional analysis with δP = 8. The blue, red, and green areas represent the cases in which the ratios of molten material in the resulting planet are δP,molten = 0, 0.15, 0.3 respectively.The vertical red and blue lines represent the extent of the red and blue areas. The light colors represent |δfT | < 40%, medium colors represent |δfT| < 13%, and dark colors represent |δfT| < 6%. The black dashed line highlights δenrich = 0 and the black solid line highlights |δfT| = 0.
Current usage metrics show cumulative count of Article Views (full-text article views including HTML views, PDF and ePub downloads, according to the available data) and Abstracts Views on Vision4Press platform.
Data correspond to usage on the plateform after 2015. The current usage metrics is available 48-96 hours after online publication and is updated daily on week days.
Initial download of the metrics may take a while.