Fig. 1.
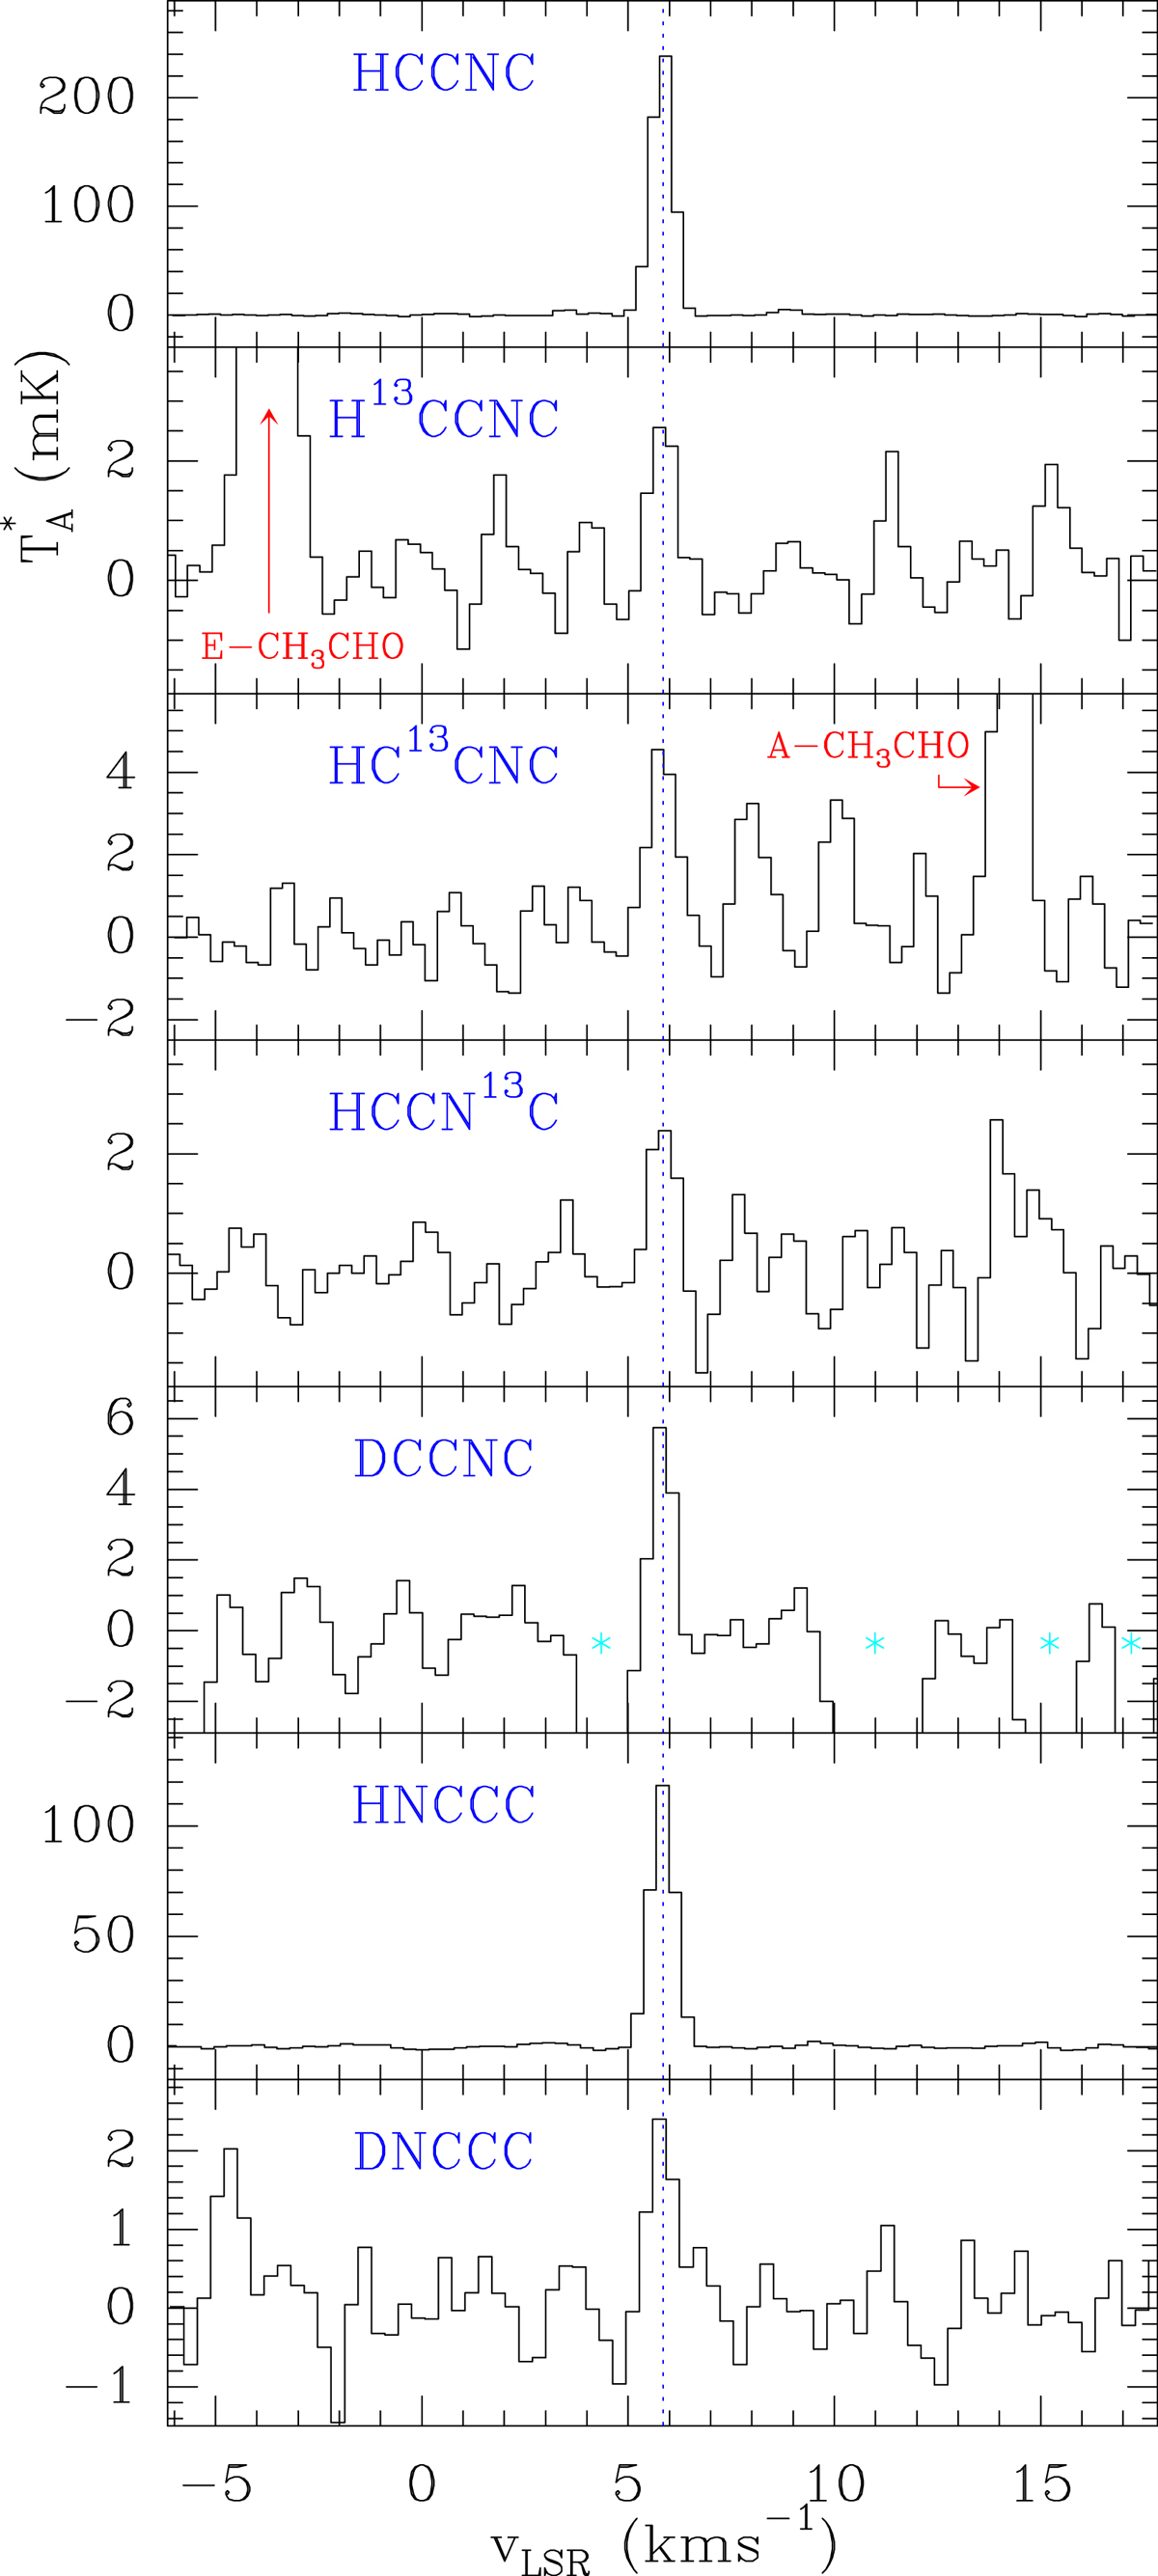
J = 4 − 3 transition of HNCCC, HCCNC, and some of their isotopologues, observed towards TMC-1. The abscissa corresponds to the local standard of rest velocity in km s−1. Frequencies and intensities for the observed lines are given in Table A.1. The ordinate is the antenna temperature corrected for atmospheric and telescope losses in mK. Cyan stars indicate the position of ghost negative features in the spectra produced by the frequency switching observation mode. Other spectral features arising from other molecular species, or otherwise unidentified, are labeled in the different panels.
Current usage metrics show cumulative count of Article Views (full-text article views including HTML views, PDF and ePub downloads, according to the available data) and Abstracts Views on Vision4Press platform.
Data correspond to usage on the plateform after 2015. The current usage metrics is available 48-96 hours after online publication and is updated daily on week days.
Initial download of the metrics may take a while.