| Issue |
A&A
Volume 642, October 2020
|
|
|---|---|---|
| Article Number | L4 | |
| Number of page(s) | 5 | |
| Section | Letters to the Editor | |
| DOI | https://doi.org/10.1051/0004-6361/202039215 | |
| Published online | 02 October 2020 | |
Letter to the Editor
Collinder 135 and UBC 7: A physical pair of open clusters
1
Institute of Astronomy, Russian Academy of Sciences, 48 Pyatnitskya St, Moscow 119017, Russia
e-mail: This email address is being protected from spambots. You need JavaScript enabled to view it.
2
Main Astronomical Observatory, National Academy of Sciences of Ukraine, 27 Akademika Zabolotnoho St, 03143 Kyiv, Ukraine
3
National Astronomical Observatories and Key Laboratory of Computational Astrophysics, Chinese Academy of Sciences, 20A Datun Rd., Chaoyang District, Beijing 100101, PR China
4
Zentrum für Astronomie der Universität Heidelberg, Astronomisches Rechen-Institut, Mönchhofstr 12-14, 69120 Heidelberg, Germany
5
Landessternwarte, Zentrum für Astronomie der Universität Heidelberg, Königstuhl 12, 69117 Heidelberg, Germany
Received:
19
August
2020
Accepted:
4
September
2020
Abstract
Context. Given the closeness of the two open clusters Collinder 135 and UBC 7 on the sky, we investigate the possibility that the two clusters are physically related.
Aims. We aim to recover the present-day stellar membership in the open clusters Cr 135 and UBC 7 (300 pc from the Sun) in order to constrain their kinematic parameters, ages, and masses and to restore their primordial phase space configuration.
Methods. The most reliable cluster members are selected with our traditional method modified for the use of Gaia DR2 data. Numerical simulations use the integration of cluster trajectories backwards in time with our original high-order Hermite4 code φ−GRAPE.
Results. We constrain the age, spatial coordinates, velocities, radii, and masses of the clusters. We estimate the actual separation of the cluster centres equal to 24 pc. The orbital integration shows that the clusters were much closer in the past if their current line-of-sight velocities are very similar and the total mass is more than seven times larger than the mass of the most reliable members.
Conclusions. We conclude that the two clusters Cr 135 and UBC 7 might very well have formed a physical pair based on the observational evidence as well as numerical simulations. The probability of a chance coincidence is only about 2%.
Key words: open clusters and associations: individual: Collinder 135 / open clusters and associations: individual: UBC 7 / methods: numerical
© ESO 2020
1. Introduction
Gravitating matter tends to cluster and form objects on different scales. It is suspected that, similar to stars, star clusters may form groups (Elmegreen & Efremov 1996; Fujimoto & Kumai 1997; Bonatto & Bica 2010; Gusev & Efremov 2013) and physical pairs. The fraction of these binary clusters was first estimated at a level of 20 % (Rozhavskii et al. 1976) but this estimate later decreased to 10 % (de La Fuente Marcos & de La Fuente Marcos 2009). The latter and some other works (see, e.g., Vázquez et al. 2010; Conrad et al. 2017) give lists of potential cluster binaries and even triplets, however many of them have since been dismissed (Vázquez et al. 2010; Soubiran et al. 2018).
Using the Gaia DR2 catalogue, Soubiran et al. (2018) shortened the list to 11 pairs. The prime candidates in our Galaxy are h and χ Per. These are large and massive open clusters that are close to each other on the sky, with nearly the same distance of 2.2 ± 0.2 kpc from the Sun (e.g., Zhong et al. 2019). However, this large distance makes their detailed study difficult.
Meanwhile, the Magellanic Clouds may contain a large number of binary clusters (e.g., Bhatia & Hatzidimitriou 1988; Hatzidimitriou & Bhatia 1990; Pietrzynski & Udalski 1999; Dieball et al. 2002). Numerical simulations (e.g., Portegies Zwart & Rusli 2007) and spectroscopic investigations (e.g., Mora et al. 2019) prove the existence of physical pairs of clusters in the Large Magellanic Cloud. The difference in the number of binary clusters between the Magellanic Clouds and our own Galaxy can be explained by some kind of observational bias (e.g. Vázquez et al. 2010) or by peculiarities of the formation and/or destruction processes in different types of galaxies.
Numerical simulations of a test binary cluster in the Galactic tidal field demonstrate a complicated dependence between its initial properties and future history before the components actually merge and produce a single rotating star cluster (Priyatikanto et al. 2016). These results were not tested on real Galactic clusters because of the lack of relevant observational data.
The Gaia mission (Gaia Collaboration 2018) resulted in the discovery of many previously unknown clusters (e.g. Castro-Ginard et al. 2018, 2020; Cantat-Gaudin et al. 2018). One of them, UBC 7, was found at a distance of ∼300 pc from the Sun near the well-known open cluster Collinder 135 (hereafter Cr 135) and mentioned as probably related to it (Castro-Ginard et al. 2018). Before Gaia, the stars now attributed to UBC 7 were considered to be part of Cr 135. With the use of Gaia DR2, in this paper, we first aim at disentangling the stellar membership between the two clusters and at obtaining the most probable kinematic parameters of the clusters in 6D space. We use these data to recover plausible initial conditions of the clusters, enabling a future study of their detailed evolution with full-scale N-body simulations.
2. Characterising Cr 135 and UBC 7 with Gaia DR2
Cr 135 and UBC 7 are located at a distance of approximately 300 pc in the Vela-Puppis star formation region (245 deg ≲ l ≲ 265 deg, −15 deg ≲ b ≲ −5 deg), which was recently thoroughly investigated with respect to its large-scale structure and kinematics using Gaia DR2 data (Cantat-Gaudin et al. 2019a,b; Beccari et al. 2020). In particular, the region at distances between 250 and 500 pc hosts several young open clusters divided into groups of similar age. The oldest group (30–50 Myr according to different authors, e.g. Cantat-Gaudin et al. 2019a; Beccari et al. 2020) includes Cr 135 and UBC 7.
2.1. Cluster membership
As a compromise, that is in order to study the outer regions of the clusters and simultaneously avoid contamination from nearby groups, we used all sources of Gaia DR2 within a radius of 6.5 deg around the centre of Cr 135 (α = 108.3 deg, δ = −37.35 deg, also applicable to UBC 7) that satisfy requirements for “astrometrically pure” solutions according to Lindegren et al. (2018) and technical note GAIA-C3-TN-LU-LL-124-011. This includes the following requirements: ruwe < 1.4, using limits for the flux excess factor (Lindegren et al. 2018), and selecting sources with σϖ/ϖ ≤ 10%. The number of sources satisfying these requirements is 411 153. For each of these sources, we calculated the cluster membership probability (MP) for Cr 135 or UBC 7 following the principles formulated in Kharchenko et al. (2012) with specific adjustments to use Gaia DR2 data described below.
Initial estimates of basic parameters  ,
,  ,
,  , age Tk, Ek(BP − RP) of Cr 135 (k = 1) and UBC 7 (k = 2) were obtained for a subsample of evident members of the two clusters based on a visual analysis of astrometric and photometric diagrams: the vector point diagram (VPD), a parallax versus magnitude plot (ϖ, G), and a Gaia colour–magnitude diagram (CMD). The parameters were further adjusted along with a list of cluster members in an iterative procedure (see details in Kharchenko et al. 2012). Isochrones for Gaia DR2 passbands from Maíz Apellániz & Weiler (2018) were obtained from the Padova webserver CMD3.32 based on the calculations by Bressan et al. (2012) for solar metallicity Z = 0.0152. We applied systematic corrections for the G magnitudes of sources3 to adjust for the use of these passbands. We used a relation between E(BP − RP) and AG based on coefficients provided at CMD3.3 for Aλ/AV for Gaia photometric bands following the relations by Cardelli et al. (1989) and O’Donnell (1994), which leads to AG/E(BP − RP)≈2.05.
We find that the ages of the two clusters cannot be distinguished, nor can their reddenings, and so we use only one value for both clusters. In contrast, proper motions and mean parallaxes of the selected groups of stars are clearly different.
The modification to derive the mean parameters of the clusters with respect to that described in Kharchenko et al. (2012) involves taking into account the parallax probability  and the photometric probability
  based on the (G, BP − RP) CMD to derive MP. The resulting MP is given by:
 (1)
(1)
The values for parameters  , characterising the expected dispersion of cluster member parameters in calculation of the probabilities
  ,
,  , and
, and  , are estimated as follows. The dispersion of proper motions in the clusters at 300 pc distance is mainly due to actual velocity dispersion of cluster members rather than due to proper motion errors of individual stars (mean value of 0.15 mas yr−1, maximum of 0.45 mas yr−1 for cluster member candidates). We set εμl, εμb = 1.8 mas yr−1.
In turn, the dispersion of parallaxes is dominated by the accuracy of the observations rather than by the actual dispersion of the distances. The pre-defined limit of a relative error of 10% corresponds to approximately 25 pc at the given distance, which is definitely more than the spatial dispersion of members of moderately sized open clusters. For the allowances for parallaxes of possible cluster members, we use an expression for the external calibration of the parallax error4. The value of  is defined from the dispersion of mean parallaxes obtained at the initial selection of reliable cluster members, equal to 0.12 mas for each cluster, and individual photometric error
  estimated by flux and flux error in G.
Figure 1 represents the distribution of the selected members over the map of the considered region (a), VPD (b), magnitude–parallax diagram (c), and CMD (d). One can see that the dispersion of observational data of probable members allows us to distinguish the clusters in panels (a), (b), and (c), but not in (d).
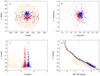 |
Fig. 1. Observational data for Cr 135 and UBC 7: red dots represent sources with larger Cr 135 MPs, and blue dots sources with larger UBC 7 MPs. Shade dots are for Gaia DR2 sources with Pi, k < 0.01 for both clusters. (a) Location of probable members of Cr 135 and UBC 7 in the Galactic l, b-plane; (b) VPD; (c) magnitude–parallax diagram; and (d) CMD. In panel d red and blue lines represent isochrones for 40 Myr. The green line is for zero-age main sequence built in the present study as a hot envelope of the related set of Padova isochrones of different ages. Absolute magnitudes and colours are reduced to the apparent scale using mean parallaxes and reddening of central probable members. Large circles in panel a mark central regions of the clusters (see Sect. 2.2). |
2.2. Parameters of the clusters
With the MPs to the two clusters figured out, we derive ages of between 40 and 50 Myr. We select sources with Pi, k > 0.6 as the most probable members of Cr 135 and UBC 7. Totals of 244 and 184 stars are identified as probable members of Cr 135 and UBC 7, respectively. Twelve stars are probable members of both clusters.
The distribution of probable cluster members in the sky looks like two relatively compact cores surrounded by a halo of stars extending to more than 5 deg from the centres of the clusters. We estimate the probability of a random contamination of the dataset with field stars, applying the search procedure to stars satisfying the same conditions as those selected as probable members of Cr 135 and UBC 7 in eight equal areas at the perimeter of the Vela-Puppis region. The resulting selections provide between zero and seven false members in the area. Thus, the extended structures hosting tens of probable members around Cr 135 and UBC 7 are not due to occasional field contamination and may be a part of the extended common halo of the two clusters, or a signature of filamentary structures discovered by Beccari et al. (2020). Sometimes, it is difficult to attribute a star satisfying the membership conditions to one cluster or the other, or to the outer structure. We select only the probable members belonging to the central parts of the two clusters to access the motion of the cluster centres.
The coordinates and parallaxes of the cluster centres are derived from the position of the maxima of the stellar-density distribution of the probable members of Cr 135 and UBC 7. The radii of the central parts of clusters are selected as estimates of their apparent half-mass radii (HMR, see, e.g., Röser et al. 2011). For this purpose, masses are attributed to probable members by setting them onto the isochrone for 40 Myr (unresolved binaries neglected). Such lower boundary estimates for the total mass based on the most probable members with pure astrometric data are 126 M⊙ and 87 M⊙ for Cr 135 and UBC 7, respectively. The consequent angular HMRs are 1.20 deg and 1.13 deg, respectively. These estimates agree with those for tidal radii according to King’s formula (King 1962), and half-number radii, within 10% to 30%. Further, we use the HMR to define the central parts of the clusters (shown with large circles in Fig. 1a) to obtain estimates for the mean basic parameters of Cr 135 and UBC 7. The central parts contain 91 stars for Cr 135 and 80 stars for UBC 7.
In Table 1, we quote cluster parameters computed via averaging of individual data points on l, b, ϖ, μl, and μb for probable members residing within the central areas. For l and b, the accuracies are computed as standard deviations. For ϖ, μl, and μb, the accuracies are computed as a combination of error of the mean and expected systematic error estimate 4. The number of stars with line-of-sight (LOS) velocity measurements in the central parts of clusters is low: 14 and 5 sources only for Cr 135 and UBC 7, respectively. To increase our sample size, and thus bolster statistical significance, we take into account not only astrometrically pure but all probable cluster members with LOS velocity measurements (30 and 24 sources, respectively), and quote their median values. The accuracies are evaluated as 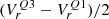 where
where  and
and  are LOS velocities corresponding to lower and upper quartiles.
Main cluster parameters evaluated for the most reliable members.
The kinematics and age obtained for the two considered clusters are very similar. The separation between the centres of Cr 135 and UBC 7 is 24.2 ± 2.1 pc and the difference in proper motion is 0.6 ± 0.1 mas yr−1 (the relative tangential velocity is 1.42 ± 0.15 km s−1). A simple model of the local vicinity based on parameters by Cantat-Gaudin et al. (2019a) hosts six clusters in a region with dimensions [100, 50, 200] pc with μl, μb ranging within 6 mas yr−1. If their positions and proper motions are distributed randomly, the likelihood of some pair of clusters simultaneously having spatial distance of less than 25 pc and differences in proper motion of less than 0.7 mas yr−1 is quite small (Pr = 2.4%), and therefore it seems unlikely that Cr 135 and UBC 7 are located so close together by chance.
3. Orbital integration of the star clusters in the Milky Way potential
In this paper, we restrict ourselves to the simplest model of the star clusters as attracting point masses orbiting in the fixed Milky Way external potential (Ernst et al. 2011). We carry out the integration backwards in time up to −50 Myr using our own developed high-order Hermite4 code φ−GRAPE (Harfst et al. 2007). The current version of the φ−GRAPE5 code uses GPU/CUDA-based GRAPE emulation YEBISU library (Nitadori & Makino 2008); it was tested and successfully applied in our previous large-scale simulations (Polyachenko et al. 2020; Kennedy et al. 2016; Wang et al. 2014; Zhong et al. 2014; Li et al. 2012; Just et al. 2012).
The largest uncertainty on kinematic data is on the LOS velocities. Therefore, we probe these velocities on a uniform mesh of 101 × 101 runs covering ±3σ-confidence intervals, while other parameters are kept fixed at the averaged values. A pair of initial (t = 0) LOS velocities gives coordinates rk(t) and velocities vk(t) of the clusters. Our fiducial series of runs assumes the cluster mass ratio close to that from Table 1, but the actual values M1 = 465 M⊙ and M2 = 302 M⊙ are larger because the table data contain the present-day masses of the most reliable members only.
First of all, we are looking for runs with small primordial separations S(−T), where S(t) = |r1(t) − r2(t)| is the distance between the clusters. The small colour squares in Fig. 2a mark runs with separations S below 15 pc at age T = 50 Myr (the plot is similar for T = 40 Myr). These runs settle in a narrow band near the lines of equal LOS velocities. The rimmed circles mark ‘bound’ runs with negative (specific) energy:
 (2)
(2)
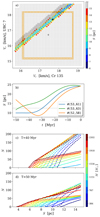 |
Fig. 2. Numerical backward integration of two point masses representing the clusters in the external Milky Way potential. (a) The run mesh (fragment) for cluster age T = 50 Myr: small squares represent individual runs with different present-day (t = 0) LOS velocities. Coloured squares mark runs with primordial separations smaller than 15 pc. The black plus and star denote the central Vr values and run #(53,61) given in panel b. Rimmed circles mark runs with negative primordial energy EK. The dashed black line and the orange rectangle depict the line of equal LOS velocities and the runs within ±1σ from mid values. (b) Typical curves of separation S(t). (c, d) The cumulative number of runs vs. the primordial separation below 15 pc for 40 and 50 Myr. The dashed lines show all runs within 1σ-rectangle, and the solid lines show only runs with negative energy EK (bound). Colours of the lines code the total mass M of the clusters. |
which does not account for the external Galactic field. At an age of 40 Myr, none of these runs are bound, although some with the positive EK lead to primordial separations below 10 pc. At 50 Myr of age, the runs show a minimum separation of 8.8 pc, and for the bound runs this is 9.1 pc.
Figure 2b presents typical separation curves. Runs in the grey zone and some on both sides of the colour zone have curves similar to #(52,58) with a trend of initial convergence and then increase of the separation. Monotonic separation growth is met in runs with very similar LOS velocities (either with negative or positive primordial energy); see for example runs #(53,61) and #(53,63). The dashed line indicates the position of the tidal (Jacobi) radius for the system of two attracting points. Clusters formed closer than the Jacobi radius with total energy below the Jacobi energy will stay close forever. In contrast, clusters formed with energy larger than the Jacobi energy can defy mutual attraction either because of the tidal force (EK < 0) or high relative velocity (EK > 0).
To account for the mass uncertainty, in addition to the fiducial series we explored ten more series increasing and decreasing masses proportionally in the range of M between 380 and 2300 M⊙. Similarly to the fiducial series, the runs with small separations always settle near the lines of equal LOS velocities.
Figures 2c and d present the cumulative number of runs within the 1σ-rectangle versus the primordial separation at 40 and 50 Myr, respectively. The fiducial and lighter series give no bound runs at 40 Myr, although there are some runs with EK > 0. Meanwhile, the 50 Myr plots contain bound runs at any explored value of the total mass M.
At the high-mass end, all runs with primordial separation S smaller than 15 pc are bound at 50 Myr, while only 46% are bound at 40 Myr. The separation is smaller and the width of the colour bands is narrower in T = 50 Myr plots. The latter explains smaller cumulative numbers at S ∼ 15 pc compared to T = 40 Myr. If we look at the bound runs only, clusters of age 40 Myr require a total mass M above ∼1500 M⊙ to obtain small primordial separations starting from reasonable values of LOS velocities. The 50 Myr clusters are less restrictive in this respect.
4. Conclusions
Based on Gaia DR2 data, we selected probable members of Cr 135 and UBC 7 and determined their parameters in 6D space (l, b, ϖ, μl, μb, Vr). The clusters have been shown to be close but distinctly separated, while their CMDs are indistinguishable. We assume the cluster ages to be equal and estimate this age to between 40 and 50 Myr. A model with randomised spatial and kinematic parameters shows a likelihood of only Pr = 2.4% for their chance coincidence. In addition, the observations show coronae enveloping both clusters. This suggests their possible physical binarity.
The clusters may have formed closer together than they appear now. In order to show this, we use a simple model in which the clusters are replaced by point masses and integrate backwards in time in the fixed external Galactic potential. The masses of the points were constant during the integration, and their values also accounted for the unresolved stars and possible mass loss.
Given the uncertainty in the observational data, we performed an optimisation over initial LOS velocities leading to desirable runs with small primordial separations. Such small separations are only obtained in the case of very similar LOS velocities. We then explored the question of how many desirable runs with plausible LOS velocities (within 1σ-confidence rectangle) occur in series with different total mass and age. We report that, independently of age, clusters with a total mass M ≳ 1500 M⊙ favour the scenario in which the clusters were initially close in the beginning and then were tidally separated. On the other hand, relatively young clusters with a total mass M ≲ 750 M⊙ require LOS velocities above the confidence intervals determined from observations.
The initial masses of the clusters are very uncertain. Accounting for incompleteness and mass loss by stellar evolution may result in a factor of two larger initial masses compared to the observed masses given in this paper, which is insufficient to reach the high mass regime of our investigations. On the other hand, because clusters are formed in molecular clouds with low star formation efficiency, they are most probably supervirial after gas expulsion. This leads to a significant dynamical mass loss on a dynamical timescale of 10–20 Myr. In the case of a centrally peaked star formation efficiency, the mass of the surviving cluster can be as low as 5% of the initial mass (Shukirgaliyev et al. 2017, 2018). The observed extended corona of cluster stars around Cr 135 and UBC 7 could be evidence of this latter kind of strong cluster mass loss by violent relaxation in the first 20 Myr.
In our simple model for the cluster orbits, the mass loss of the clusters was completely ignored. As a continuation of this work, in Paper II (in preparation) we shall extend our numerical simulations using realistic star cluster N-body modelling by forward integrating star-by-star cluster models to the present day and make a direct comparison of the stellar populations to the observations, including selection effects and binary stars.
Acknowledgments
This work has made use of data from the European Space Agency (ESA) mission Gaia (https://www.cosmos.esa.int/gaia), processed by the Gaia Data Processing and Analysis Consortium (DPAC, https://www.cosmos.esa.int/web/gaia/dpac/consortium). Funding for the DPAC has been provided by national institutions, in particular the institutions participating in the Gaia Multilateral Agreement. The use of TOPCAT, an interactive graphical viewer and editor for tabular data (Taylor et al. 2005), is acknowledged. The reported study was partly funded by RFBR and DFG according to the research project No. 20-52-12009. The work of PB and MI was supported by the Deutsche Forschungsgemeinschaft (DFG, German Research Foundation) Project-ID 138713538, SFB 881 (“The Milky Way System”) and by the Volkswagen Foundation under the Trilateral Partnerships grant No. 97778. PB acknowledges support by the Chinese Academy of Sciences (CAS) through the Silk Road Project at NAOC, the President’s International Fellowship (PIFI) for Visiting Scientists program of CAS and the National Science Foundation of China (NSFC) under grant No. 11673032. MI acknowledges support by the National Academy of Sciences of Ukraine under the Young Scientists Grant No. 0119U102399. The work of PB was also partially supported under the special program of the National Academy of Sciences of Ukraine “Support for the development of priority fields of scientific research” (CPCEL 6541230). We thank the referee for the helpful comments.
References
- Beccari, G., Boffin, H. M. J., & Jerabkova, T. 2020, MNRAS, 491, 2205 [CrossRef] [Google Scholar]
- Bhatia, R. K., & Hatzidimitriou, D. 1988, MNRAS, 230, 215 [NASA ADS] [Google Scholar]
- Bonatto, C., & Bica, E. 2010, MNRAS, 403, 996 [NASA ADS] [CrossRef] [EDP Sciences] [Google Scholar]
- Bressan, A., Marigo, P., Girardi, L., et al. 2012, MNRAS, 427, 127 [NASA ADS] [CrossRef] [Google Scholar]
- Cantat-Gaudin, T., Jordi, C., Vallenari, A., et al. 2018, A&A, 618, A93 [NASA ADS] [CrossRef] [EDP Sciences] [Google Scholar]
- Cantat-Gaudin, T., Jordi, C., Wright, N. J., et al. 2019a, A&A, 626, A17 [NASA ADS] [CrossRef] [EDP Sciences] [Google Scholar]
- Cantat-Gaudin, T., Mapelli, M., Balaguer-Núñez, L., et al. 2019b, A&A, 621, A115 [NASA ADS] [CrossRef] [EDP Sciences] [Google Scholar]
- Cardelli, J. A., Clayton, G. C., & Mathis, J. S. 1989, ApJ, 345, 245 [NASA ADS] [CrossRef] [Google Scholar]
- Castro-Ginard, A., Jordi, C., Luri, X., et al. 2018, A&A, 618, A59 [NASA ADS] [CrossRef] [EDP Sciences] [Google Scholar]
- Castro-Ginard, A., Jordi, C., Luri, X., et al. 2020, A&A, 635, A45 [NASA ADS] [CrossRef] [EDP Sciences] [Google Scholar]
- Conrad, C., Scholz, R. D., Kharchenko, N. V., et al. 2017, A&A, 600, A106 [NASA ADS] [CrossRef] [EDP Sciences] [Google Scholar]
- de La Fuente Marcos, R., & de La Fuente Marcos, C. 2009, A&A, 500, L13 [NASA ADS] [CrossRef] [EDP Sciences] [Google Scholar]
- Dieball, A., Müller, H., & Grebel, E. K. 2002, A&A, 391, 547 [NASA ADS] [CrossRef] [EDP Sciences] [Google Scholar]
- Elmegreen, B. G., & Efremov, Y. N. 1996, ApJ, 466, 802 [NASA ADS] [CrossRef] [Google Scholar]
- Ernst, A., Just, A., Berczik, P., & Olczak, C. 2011, A&A, 536, A64 [NASA ADS] [CrossRef] [EDP Sciences] [Google Scholar]
- Fujimoto, M., & Kumai, Y. 1997, AJ, 113, 249 [NASA ADS] [CrossRef] [Google Scholar]
- Gaia Collaboration (Brown, A. G. A., et al.) 2018, A&A, 616, A1 [NASA ADS] [CrossRef] [EDP Sciences] [Google Scholar]
- Gusev, A. S., & Efremov, Y. N. 2013, MNRAS, 434, 313 [CrossRef] [Google Scholar]
- Harfst, S., Gualandris, A., Merritt, D., et al. 2007, New Astron., 12, 357 [NASA ADS] [CrossRef] [Google Scholar]
- Hatzidimitriou, D., & Bhatia, R. K. 1990, A&A, 230, 11 [NASA ADS] [Google Scholar]
- Just, A., Yurin, D., Makukov, M., et al. 2012, ApJ, 758, 51 [NASA ADS] [CrossRef] [Google Scholar]
- Kennedy, G. F., Meiron, Y., Shukirgaliyev, B., et al. 2016, MNRAS, 460, 240 [NASA ADS] [CrossRef] [Google Scholar]
- Kharchenko, N. V., Piskunov, A. E., Schilbach, E., Röser, S., & Scholz, R.-D. 2012, A&A, 543, A156 [NASA ADS] [CrossRef] [EDP Sciences] [Google Scholar]
- King, I. 1962, AJ, 67, 471 [NASA ADS] [CrossRef] [Google Scholar]
- Li, S., Liu, F. K., Berczik, P., Chen, X., & Spurzem, R. 2012, ApJ, 748, 65 [Google Scholar]
- Lindegren, L., Hernández, J., Bombrun, A., et al. 2018, A&A, 616, A2 [NASA ADS] [CrossRef] [EDP Sciences] [Google Scholar]
- Maíz Apellániz, J., & Weiler, M. 2018, A&A, 619, A180 [NASA ADS] [CrossRef] [EDP Sciences] [Google Scholar]
- Mora, M. D., Puzia, T. H., & Chanamé, J. 2019, A&A, 622, A65 [NASA ADS] [CrossRef] [EDP Sciences] [Google Scholar]
- Nitadori, K., & Makino, J. 2008, New Astron., 13, 498 [NASA ADS] [CrossRef] [Google Scholar]
- O’Donnell, J. E. 1994, ApJ, 422, 158 [NASA ADS] [CrossRef] [Google Scholar]
- Pietrzynski, G., & Udalski, A. 1999, Acta Astron., 49, 165 [NASA ADS] [Google Scholar]
- Polyachenko, E. V., Berczik, P., Just, A., & Shukhman, I. G. 2020, MNRAS, 492, 4819 [NASA ADS] [CrossRef] [Google Scholar]
- Portegies Zwart, S. F., & Rusli, S. P. 2007, MNRAS, 374, 931 [NASA ADS] [CrossRef] [Google Scholar]
- Priyatikanto, R., Kouwenhoven, M. B. N., Arifyanto, M. I., Wulandari, H. R. T., & Siregar, S. 2016, MNRAS, 457, 1339 [Google Scholar]
- Röser, S., Schilbach, E., Piskunov, A. E., Kharchenko, N. V., & Scholz, R. D. 2011, A&A, 531, A92 [NASA ADS] [CrossRef] [EDP Sciences] [Google Scholar]
- Rozhavskii, F. G., Kuz’mina, V. A., & Vasilevskii, A. E. 1976, Astrophysics, 12, 204 [NASA ADS] [CrossRef] [EDP Sciences] [Google Scholar]
- Shukirgaliyev, B., Parmentier, G., Berczik, P., & Just, A. 2017, A&A, 605, A119 [NASA ADS] [CrossRef] [EDP Sciences] [Google Scholar]
- Shukirgaliyev, B., Parmentier, G., Just, A., & Berczik, P. 2018, ApJ, 863, 171 [NASA ADS] [CrossRef] [Google Scholar]
- Soubiran, C., Cantat-Gaudin, T., Romero-Gómez, M., et al. 2018, A&A, 619, A155 [NASA ADS] [CrossRef] [EDP Sciences] [Google Scholar]
- Taylor, M. B. 2005, ASP Conf. Ser., 347, 29 [Google Scholar]
- Vázquez, R. A., Moitinho, A., Carraro, G., & Dias, W. S. 2010, A&A, 511, A38 [NASA ADS] [CrossRef] [EDP Sciences] [Google Scholar]
- Wang, L., Berczik, P., Spurzem, R., & Kouwenhoven, M. B. N. 2014, ApJ, 780, 164 [Google Scholar]
- Zhong, J., Chen, L., Kouwenhoven, M. B. N., et al. 2019, A&A, 624, A34 [CrossRef] [EDP Sciences] [Google Scholar]
- Zhong, S., Berczik, P., & Spurzem, R. 2014, ApJ, 792, 137 [Google Scholar]
All Tables
All Figures
|
Fig. 1. Observational data for Cr 135 and UBC 7: red dots represent sources with larger Cr 135 MPs, and blue dots sources with larger UBC 7 MPs. Shade dots are for Gaia DR2 sources with Pi, k < 0.01 for both clusters. (a) Location of probable members of Cr 135 and UBC 7 in the Galactic l, b-plane; (b) VPD; (c) magnitude–parallax diagram; and (d) CMD. In panel d red and blue lines represent isochrones for 40 Myr. The green line is for zero-age main sequence built in the present study as a hot envelope of the related set of Padova isochrones of different ages. Absolute magnitudes and colours are reduced to the apparent scale using mean parallaxes and reddening of central probable members. Large circles in panel a mark central regions of the clusters (see Sect. 2.2). |
| In the text | |
|
Fig. 2. Numerical backward integration of two point masses representing the clusters in the external Milky Way potential. (a) The run mesh (fragment) for cluster age T = 50 Myr: small squares represent individual runs with different present-day (t = 0) LOS velocities. Coloured squares mark runs with primordial separations smaller than 15 pc. The black plus and star denote the central Vr values and run #(53,61) given in panel b. Rimmed circles mark runs with negative primordial energy EK. The dashed black line and the orange rectangle depict the line of equal LOS velocities and the runs within ±1σ from mid values. (b) Typical curves of separation S(t). (c, d) The cumulative number of runs vs. the primordial separation below 15 pc for 40 and 50 Myr. The dashed lines show all runs within 1σ-rectangle, and the solid lines show only runs with negative energy EK (bound). Colours of the lines code the total mass M of the clusters. |
| In the text | |
Current usage metrics show cumulative count of Article Views (full-text article views including HTML views, PDF and ePub downloads, according to the available data) and Abstracts Views on Vision4Press platform.
Data correspond to usage on the plateform after 2015. The current usage metrics is available 48-96 hours after online publication and is updated daily on week days.
Initial download of the metrics may take a while.