Fig. 1.
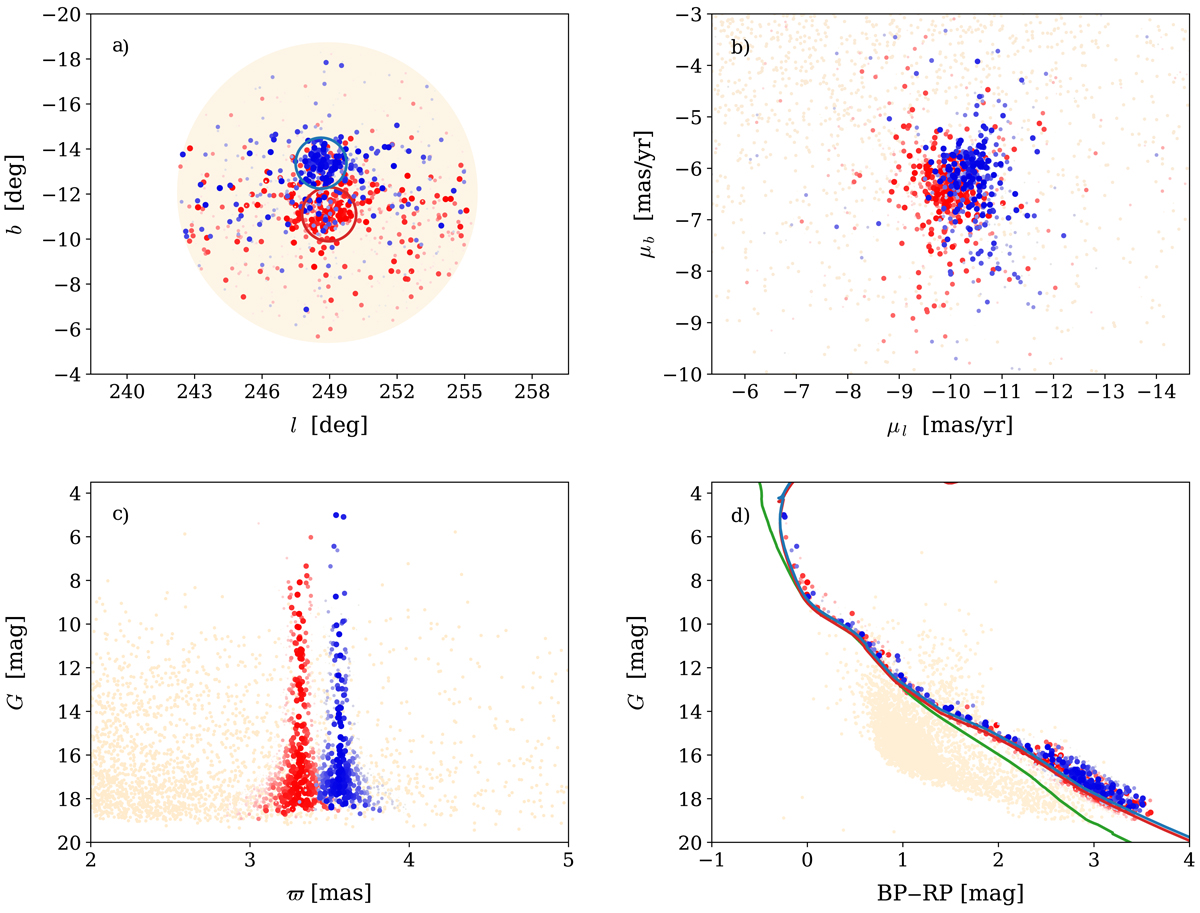
Observational data for Cr 135 and UBC 7: red dots represent sources with larger Cr 135 MPs, and blue dots sources with larger UBC 7 MPs. Shade dots are for Gaia DR2 sources with Pi, k < 0.01 for both clusters. (a) Location of probable members of Cr 135 and UBC 7 in the Galactic l, b-plane; (b) VPD; (c) magnitude–parallax diagram; and (d) CMD. In panel d red and blue lines represent isochrones for 40 Myr. The green line is for zero-age main sequence built in the present study as a hot envelope of the related set of Padova isochrones of different ages. Absolute magnitudes and colours are reduced to the apparent scale using mean parallaxes and reddening of central probable members. Large circles in panel a mark central regions of the clusters (see Sect. 2.2).
Current usage metrics show cumulative count of Article Views (full-text article views including HTML views, PDF and ePub downloads, according to the available data) and Abstracts Views on Vision4Press platform.
Data correspond to usage on the plateform after 2015. The current usage metrics is available 48-96 hours after online publication and is updated daily on week days.
Initial download of the metrics may take a while.