Fig. 3.
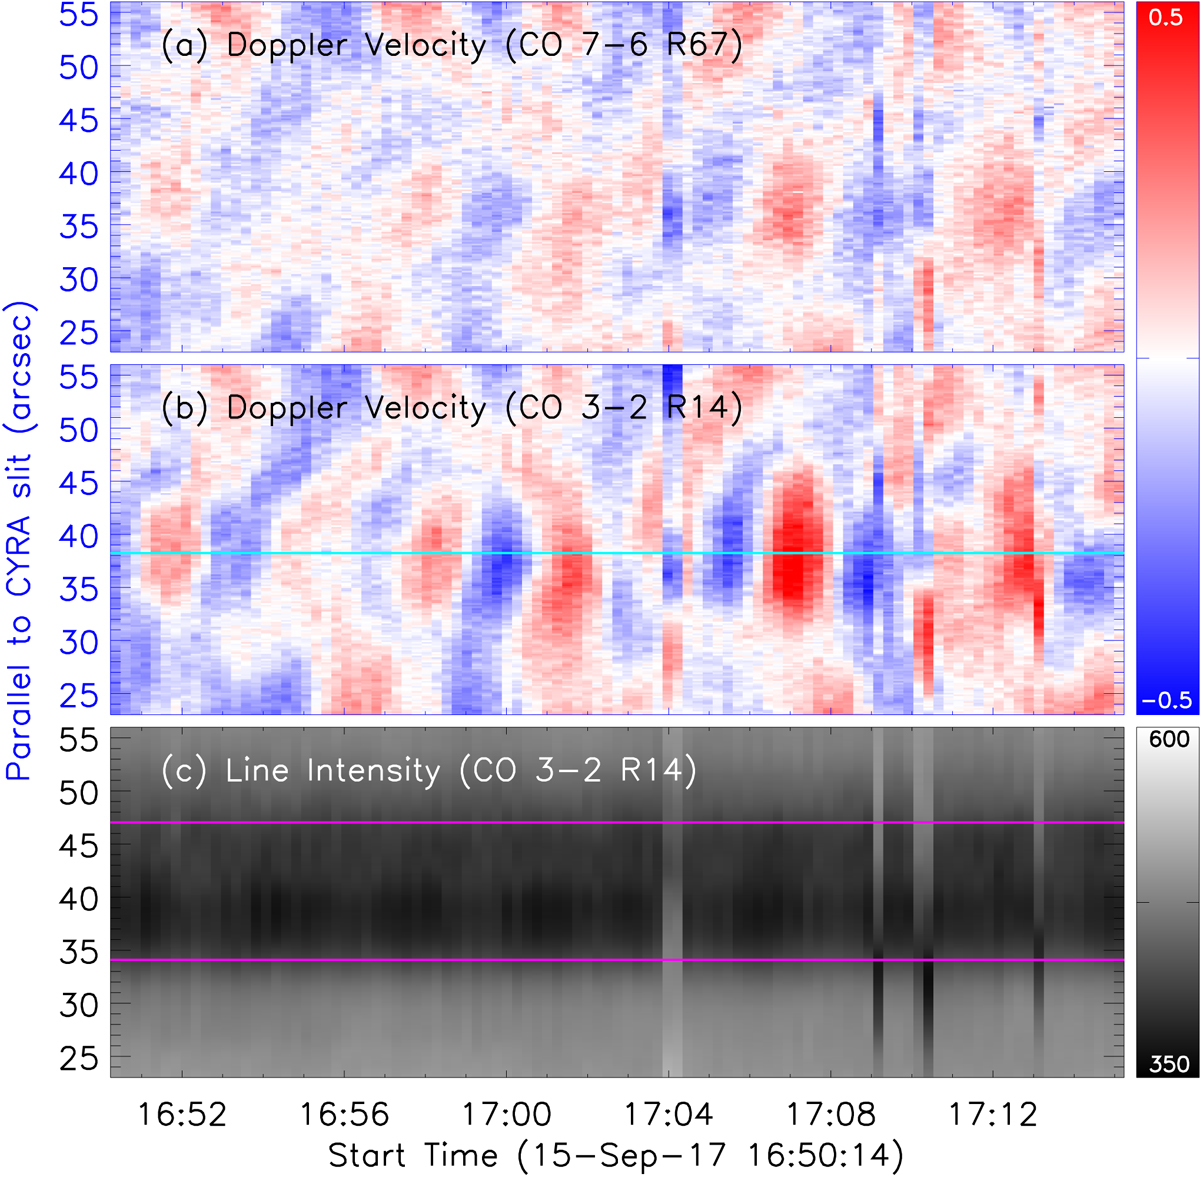
Time–distance images along the first CYRA slit (red solid line in Fig. 1) of Doppler velocity and intensity in CO 3-2 R14 and CO 7-6 R67 lines. The y-axis is parallel to the slits of CYRA. A horizontal cyan line in panel b outline the umbral position to perform the wavelet analysis in Figs. 6 and 7. Two magenta lines outline the umbra–penumbra boundary.
Current usage metrics show cumulative count of Article Views (full-text article views including HTML views, PDF and ePub downloads, according to the available data) and Abstracts Views on Vision4Press platform.
Data correspond to usage on the plateform after 2015. The current usage metrics is available 48-96 hours after online publication and is updated daily on week days.
Initial download of the metrics may take a while.