Free Access
Fig. 2.
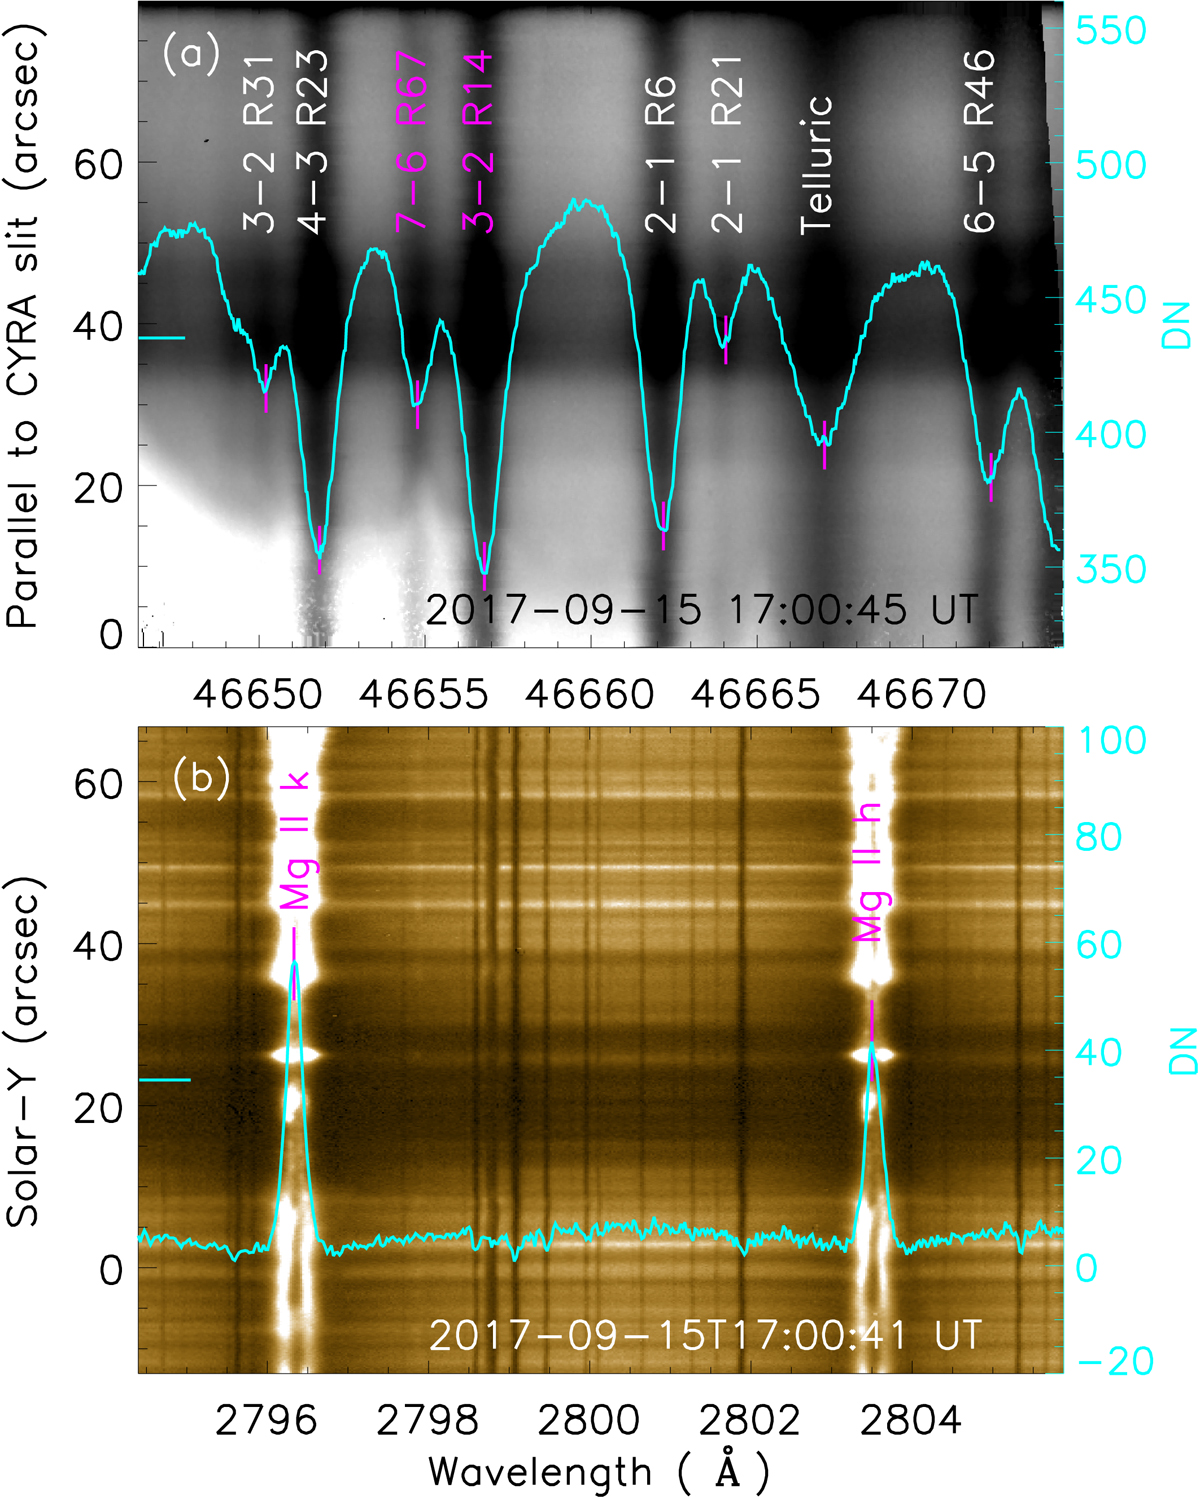
Solar spectra in infrared (a) and NUV (b) wavebands at around ∼17:00 UT measured by CYRA and IRIS, respectively. The overplotted curves are the line spectra marked by a cyan line on the left side of each image. The main lines are labeled and indicated by magenta vertical ticks.
Current usage metrics show cumulative count of Article Views (full-text article views including HTML views, PDF and ePub downloads, according to the available data) and Abstracts Views on Vision4Press platform.
Data correspond to usage on the plateform after 2015. The current usage metrics is available 48-96 hours after online publication and is updated daily on week days.
Initial download of the metrics may take a while.