Fig. 1.
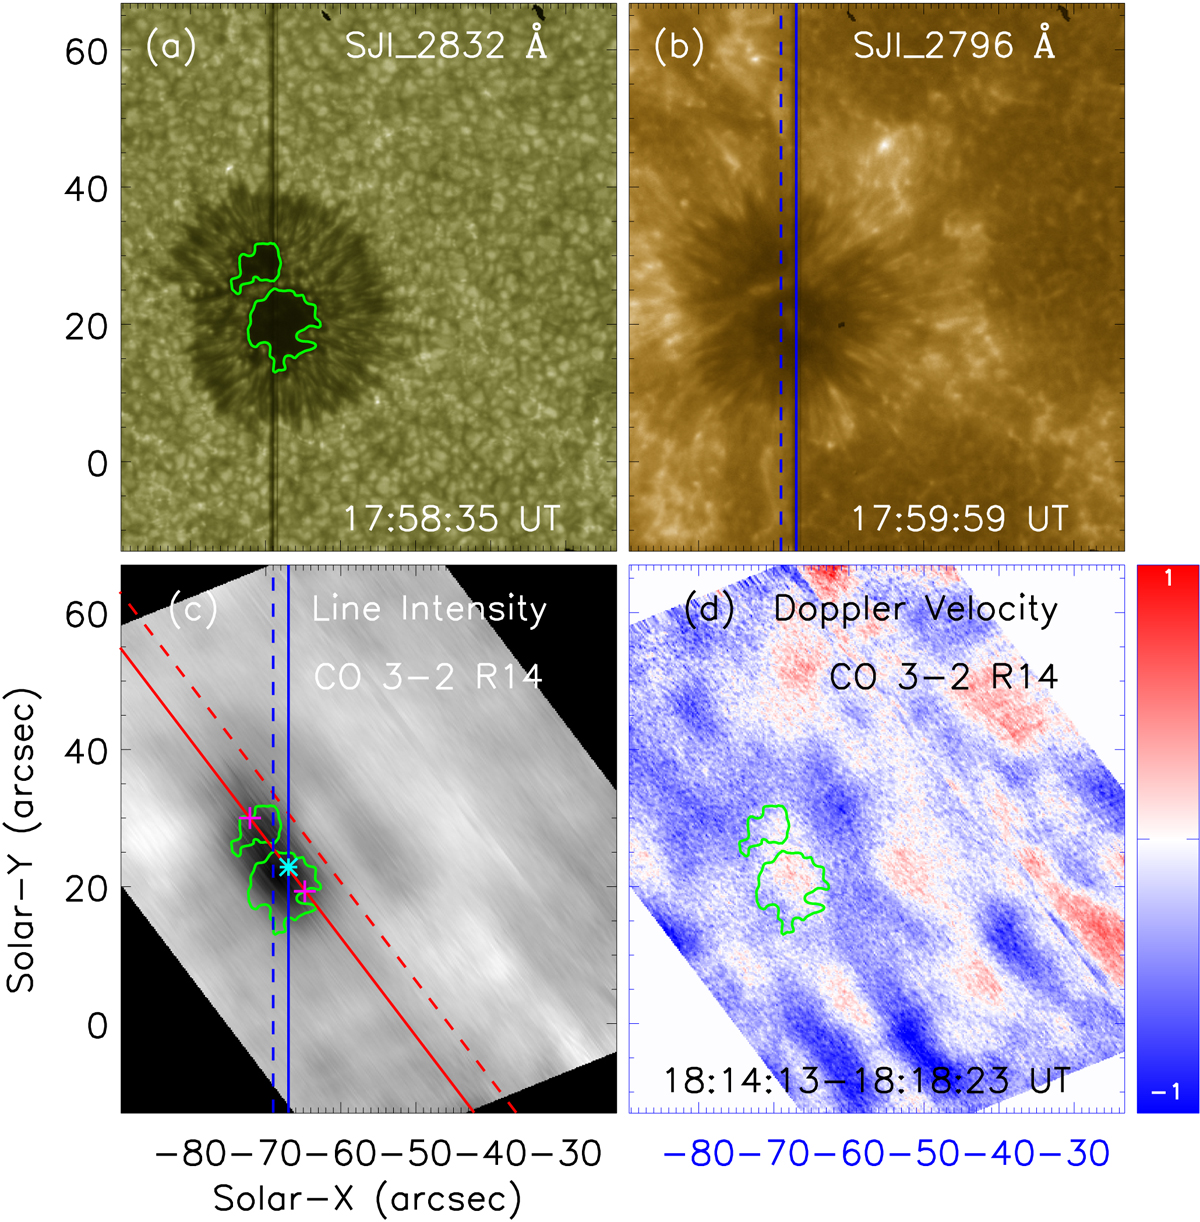
Near-UV snapshots and CO large scan images on 2017 September 15 measured by the IRIS/SJI and GST/CYRA. The green contours represent the umbra–penumbra boundary. Two blue lines outline IRIS slits, and double red lines mark the first and last (13th) slits of CYRA. The two magenta plus signs (+) in panel c indicate the umbra–penumbra boundary positions at the first CYRA slit. The cyan asterisk (*) in panel c indicates a crossover point between the slits of IRIS and CYRA at the sunspot umbra.
Current usage metrics show cumulative count of Article Views (full-text article views including HTML views, PDF and ePub downloads, according to the available data) and Abstracts Views on Vision4Press platform.
Data correspond to usage on the plateform after 2015. The current usage metrics is available 48-96 hours after online publication and is updated daily on week days.
Initial download of the metrics may take a while.