Open Access
Fig. 6.
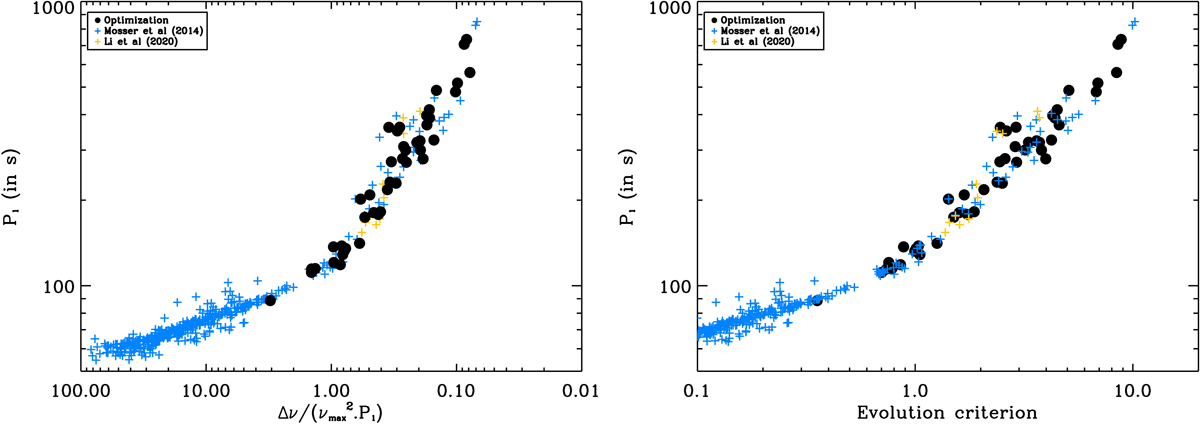
Left: period spacing of the dipole modes as a function of the number of g modes. Right: period spacing of the dipole modes as a function of the evolution criteria. Black discs: from the optimisation procedure; blue crosses: from Mosser et al. (2014); orange crosses: from Li et al. (2020).
Current usage metrics show cumulative count of Article Views (full-text article views including HTML views, PDF and ePub downloads, according to the available data) and Abstracts Views on Vision4Press platform.
Data correspond to usage on the plateform after 2015. The current usage metrics is available 48-96 hours after online publication and is updated daily on week days.
Initial download of the metrics may take a while.