Fig. 10.
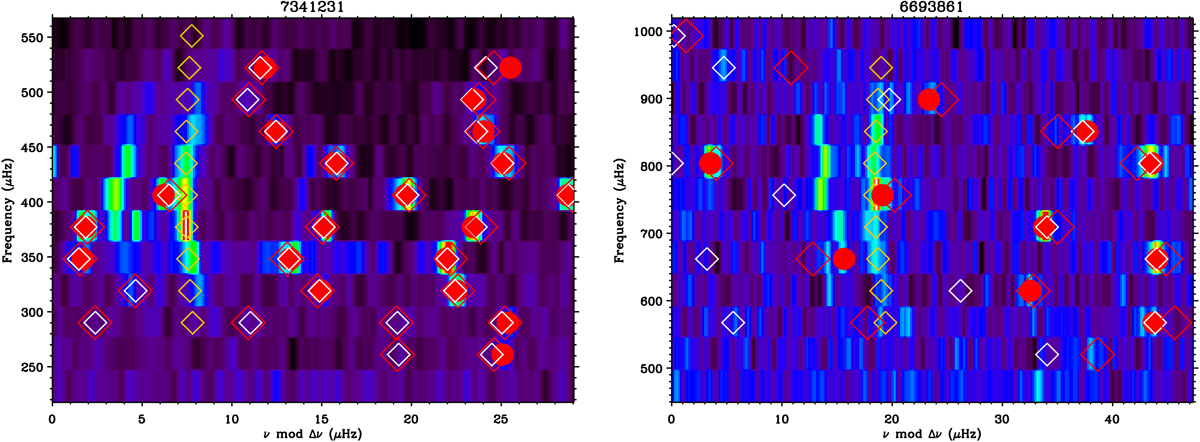
Echelle diagram of the amplitude spectra with: dipole frequencies fitted on the power spectra (red circles); l = 0 frequencies from the optimisation (orange diamonds); asymptotic dipole frequencies from the optimisation (white diamonds); and dipole frequencies from fitting the asymptotic model to the fitted frequencies (red diamonds). Left: for a case where 100% of the asymptotic frequencies match the fitted frequencies. Right: for a case where 55% of the asymptotic frequencies match the fitted frequencies.
Current usage metrics show cumulative count of Article Views (full-text article views including HTML views, PDF and ePub downloads, according to the available data) and Abstracts Views on Vision4Press platform.
Data correspond to usage on the plateform after 2015. The current usage metrics is available 48-96 hours after online publication and is updated daily on week days.
Initial download of the metrics may take a while.