Open Access
Fig. C.1.
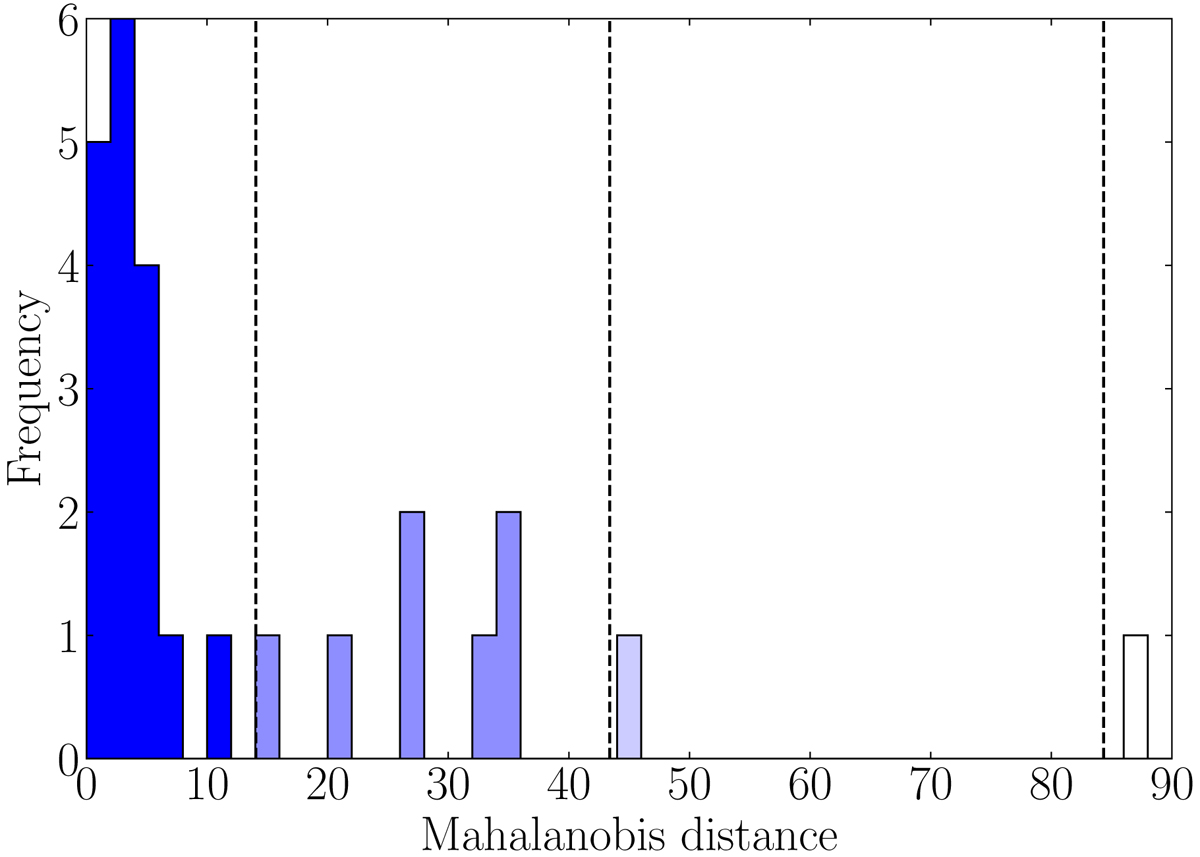
Histogram of the Mahalanobis distance to the centre of the 3D positions distribution (ξ′, η′, ζ′) of the 26 selected kinematic members of our sample, computed with the robust metric. The vertical dashed lines indicate the position of the percentiles p68, p95, and p99.7.
Current usage metrics show cumulative count of Article Views (full-text article views including HTML views, PDF and ePub downloads, according to the available data) and Abstracts Views on Vision4Press platform.
Data correspond to usage on the plateform after 2015. The current usage metrics is available 48-96 hours after online publication and is updated daily on week days.
Initial download of the metrics may take a while.