Fig. 5.
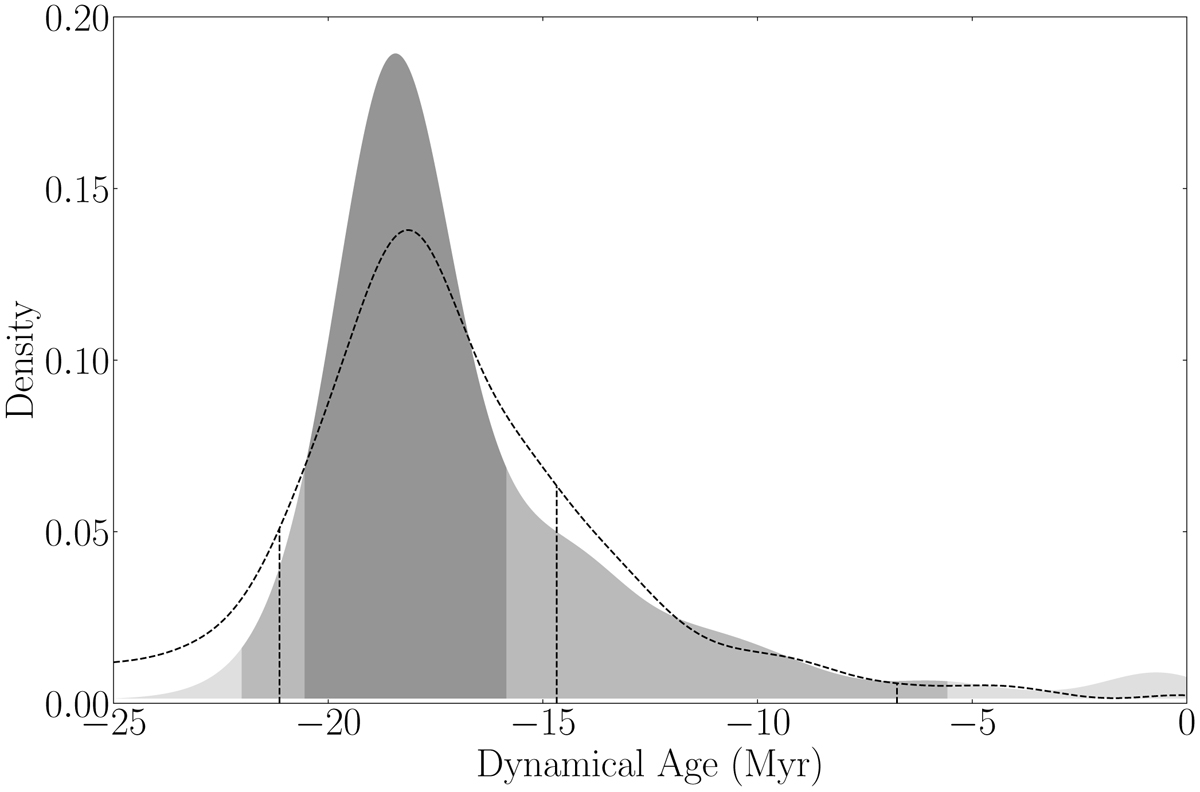
Dynamical age distribution of the bona fide β Pic members, obtained with the robust estimate of the covariance matrix. The distribution obtained with the STCM size estimator is colour-coded with the 68%, 95%, and 99.7% highest-density intervals. The distribution obtained with the SDCM size estimator is shown in dashed lines and the same highest density intervals are shown. The orbits were integrated using the new A&S potential and we computed 1000 bootstrap repetitions.
Current usage metrics show cumulative count of Article Views (full-text article views including HTML views, PDF and ePub downloads, according to the available data) and Abstracts Views on Vision4Press platform.
Data correspond to usage on the plateform after 2015. The current usage metrics is available 48-96 hours after online publication and is updated daily on week days.
Initial download of the metrics may take a while.