Fig. 4.
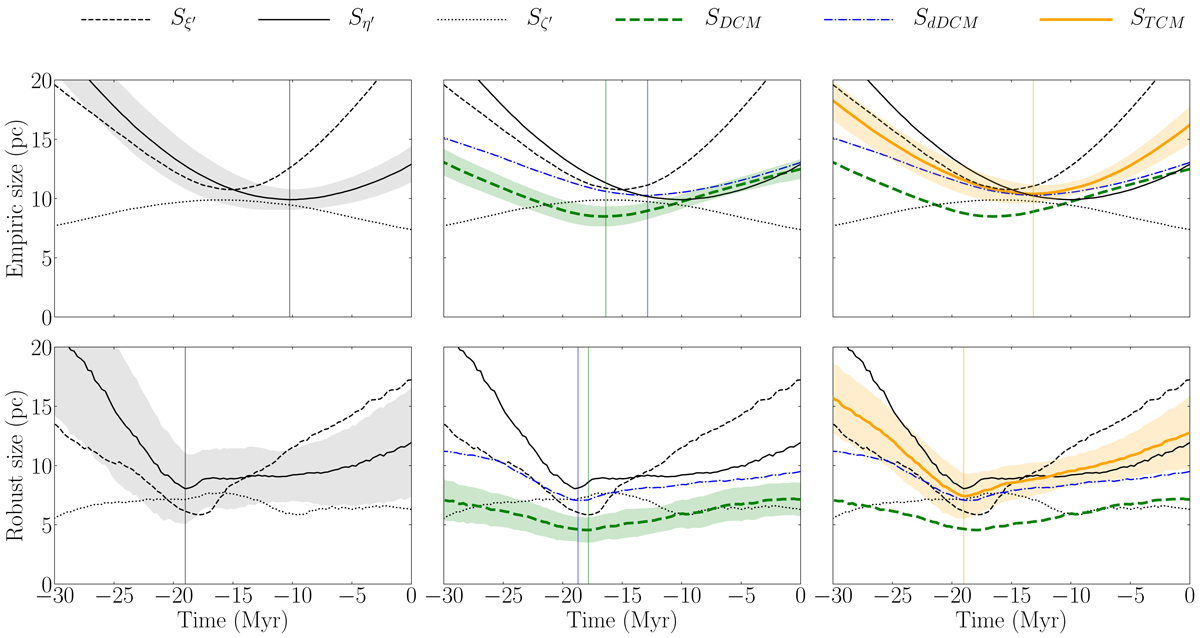
Size of the β Pic association as a function of backwards time computed with the empirical covariance estimate (top panels) and the robust covariance estimate (bottom panels). The association size estimates considered in this study are indicated in the legend and described in the text. The lines represent the median of 1000 bootstrap repetitions and the shaded areas represent the 1σ uncertainties. The orbits were integrated using the new A&S potential.
Current usage metrics show cumulative count of Article Views (full-text article views including HTML views, PDF and ePub downloads, according to the available data) and Abstracts Views on Vision4Press platform.
Data correspond to usage on the plateform after 2015. The current usage metrics is available 48-96 hours after online publication and is updated daily on week days.
Initial download of the metrics may take a while.