Free Access
Fig. 13.
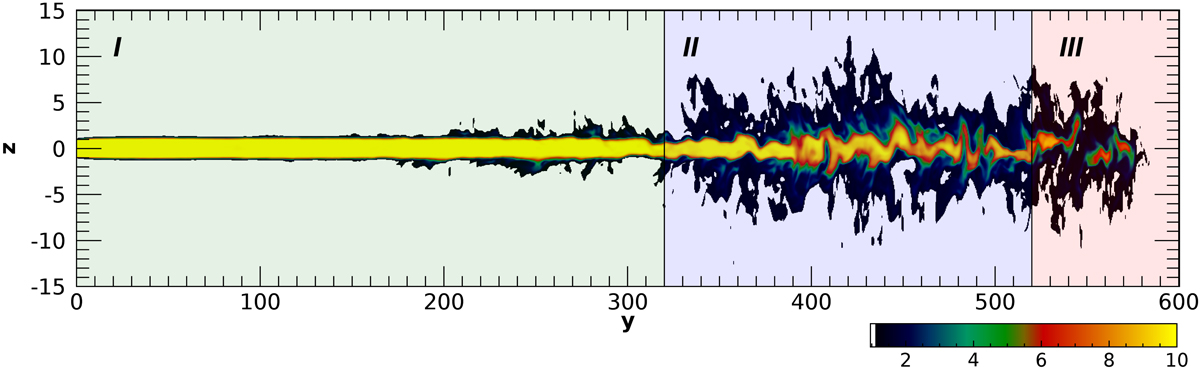
Longitudinal cut (in the y − z plane) of the distribution of the Lorentz factor for case D at t = 1300 when the jet head reaches y = 600. The three colored bands highlight the three phases described in the text.
Current usage metrics show cumulative count of Article Views (full-text article views including HTML views, PDF and ePub downloads, according to the available data) and Abstracts Views on Vision4Press platform.
Data correspond to usage on the plateform after 2015. The current usage metrics is available 48-96 hours after online publication and is updated daily on week days.
Initial download of the metrics may take a while.