Fig. 11.
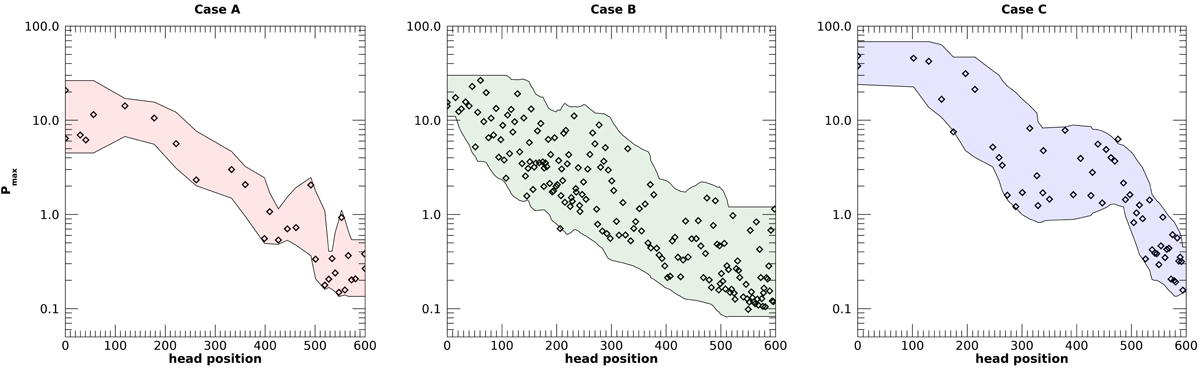
Maximum pressure found in the computational domain as a function of the position reached by the jet head. The symbols mark the values for each time, while the colored band identifies the range of variation. The three cases have different numbers of point values due to the different jet head velocities: A lower velocity (case B) implies a larger number of marks.
Current usage metrics show cumulative count of Article Views (full-text article views including HTML views, PDF and ePub downloads, according to the available data) and Abstracts Views on Vision4Press platform.
Data correspond to usage on the plateform after 2015. The current usage metrics is available 48-96 hours after online publication and is updated daily on week days.
Initial download of the metrics may take a while.