Fig. 9.
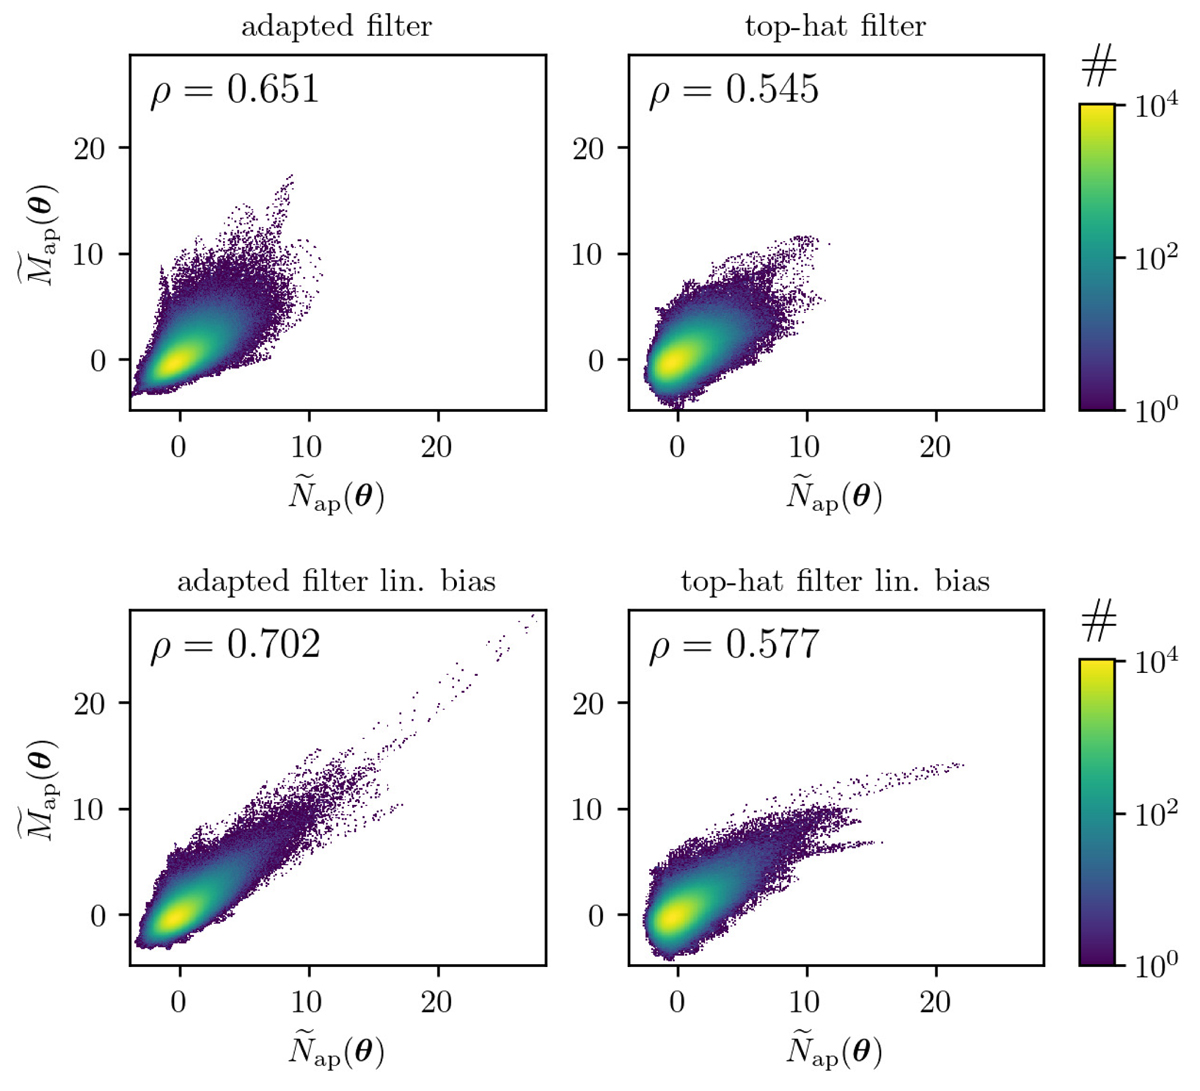
Pixel-by-pixel Map(θ) vs. Nap(θ) comparison for a non-linear bias model (upper panels) and linear bias model (lower panels). The aperture mass and number are calculated except for the outer margins for each individual pixel, which is different to Sect. 5 where ![]() is calculated from shear profiles of specific quantiles. To ease the comparison between Map(θ) and Nap(θ) we re-scaled
is calculated from shear profiles of specific quantiles. To ease the comparison between Map(θ) and Nap(θ) we re-scaled ![]() , correspondingly
, correspondingly ![]() , where ⟨…⟩ is the ensemble average over all pixel positions θ. This re-scaling does not affect the correlation coefficient ρ shown in the upper left corner of each panel. The panels on the left-hand side correspond to the adapted filter, and those on right-hand side to the top-hat filter. For both bias models, the adapted filter yields a stronger correlation, computed with Eq. (20).
, where ⟨…⟩ is the ensemble average over all pixel positions θ. This re-scaling does not affect the correlation coefficient ρ shown in the upper left corner of each panel. The panels on the left-hand side correspond to the adapted filter, and those on right-hand side to the top-hat filter. For both bias models, the adapted filter yields a stronger correlation, computed with Eq. (20).
Current usage metrics show cumulative count of Article Views (full-text article views including HTML views, PDF and ePub downloads, according to the available data) and Abstracts Views on Vision4Press platform.
Data correspond to usage on the plateform after 2015. The current usage metrics is available 48-96 hours after online publication and is updated daily on week days.
Initial download of the metrics may take a while.