Fig. 5.
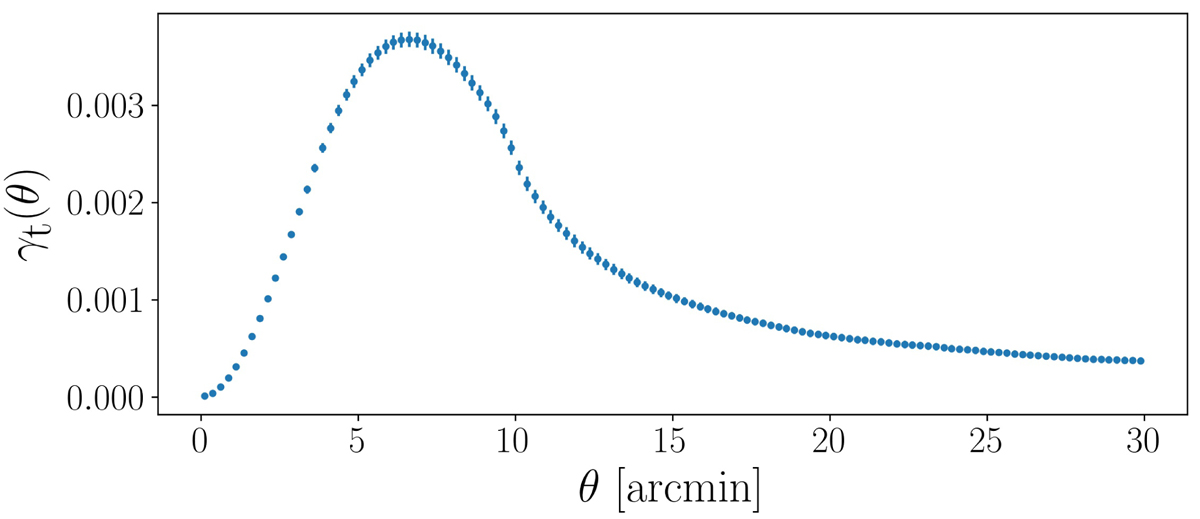
Tangential shear profile, γt, around the highest 10% pixel values of Nap determined with the filter U7 for θ < 10′ and measured up to radii of 30′ to use the strong tangential shear signal beyond 10′. For the rest of this analysis, this is the shape of the adapted filter Q. The uncertainties are the standard deviation on the mean determined with the 64 MS realisations.
Current usage metrics show cumulative count of Article Views (full-text article views including HTML views, PDF and ePub downloads, according to the available data) and Abstracts Views on Vision4Press platform.
Data correspond to usage on the plateform after 2015. The current usage metrics is available 48-96 hours after online publication and is updated daily on week days.
Initial download of the metrics may take a while.