Free Access
Fig. 3.
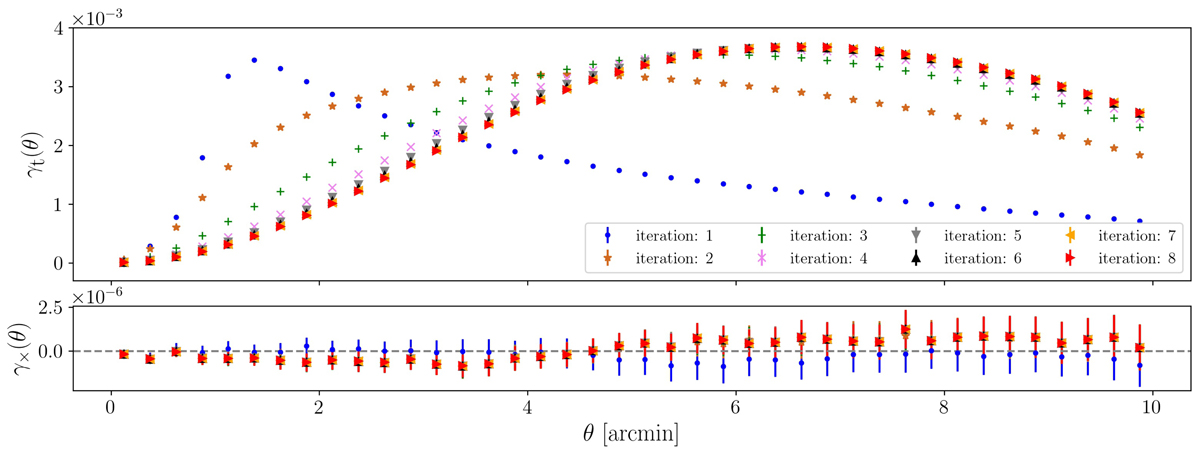
Upper panel: tangential shear profiles, γt, for the first eight iterations, showing how the peak moves to larger radii. Lower panel: γ× profiles are consistent with zero. The uncertainties are the standard deviation on the mean determined with the 64 MS realisations.
Current usage metrics show cumulative count of Article Views (full-text article views including HTML views, PDF and ePub downloads, according to the available data) and Abstracts Views on Vision4Press platform.
Data correspond to usage on the plateform after 2015. The current usage metrics is available 48-96 hours after online publication and is updated daily on week days.
Initial download of the metrics may take a while.