Fig. A.1.
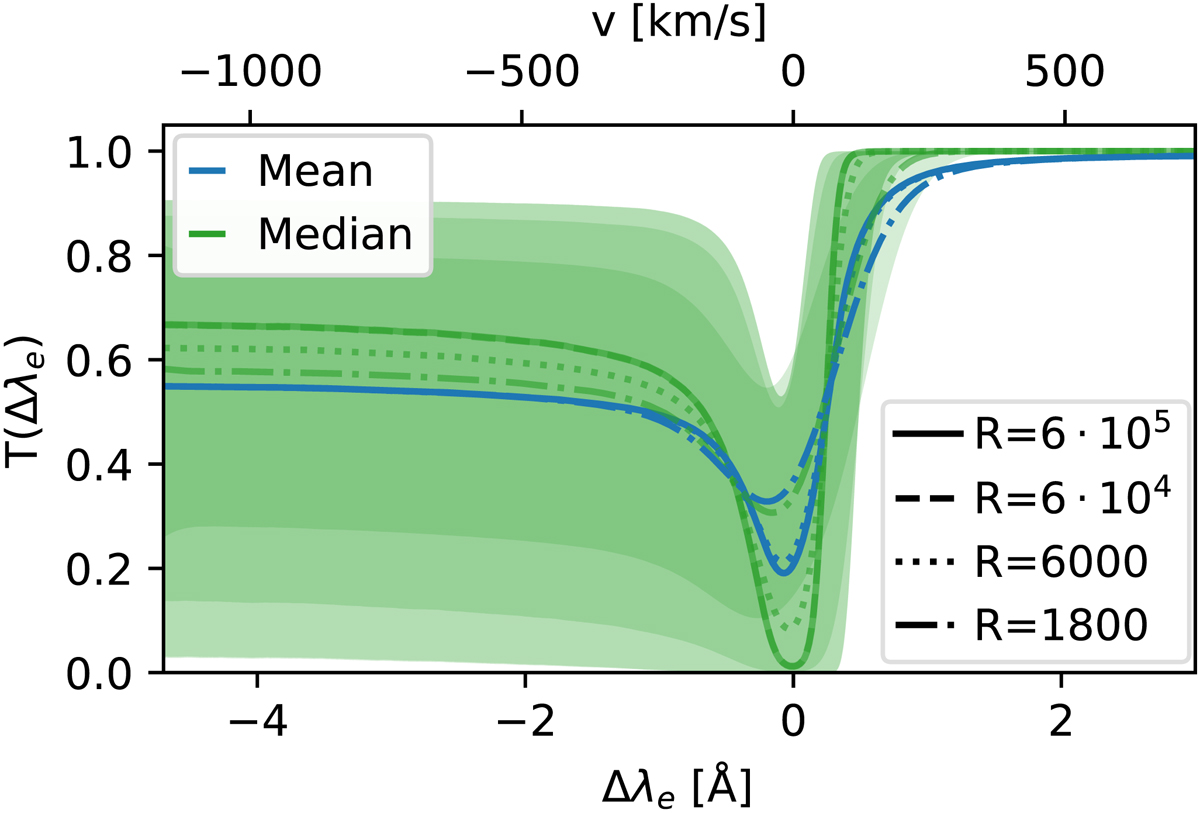
Impact of the spectral resolution on the PDFs of the transmission function T as a function of input wavelength shift Δλe. We show the PDF of T over all emitters and LOS at z = 3, similarly to Fig. 2. In blue we show the mean for a given Δλe, while in green we show the median. We show the transmission at different spectral resolutions R ∈ {600 000,60 000,6000,1800} (solid, dashed, dotted, dash-dotted). Resolutions below 600 000 are computed as convolution with a Gaussian of FWHM λFWHM that sets the spectral resolution as R = λc/λFWHM. The shaded regions enclose the central 68% of all individual transmission curves. The darkest (lightest) shade corresponds to the lowest (highest) spectral resolution. As the resolution increases the median increases and the shaded region widens. At our fiducial resolution of ∼60 000 these statistics have converged.
Current usage metrics show cumulative count of Article Views (full-text article views including HTML views, PDF and ePub downloads, according to the available data) and Abstracts Views on Vision4Press platform.
Data correspond to usage on the plateform after 2015. The current usage metrics is available 48-96 hours after online publication and is updated daily on week days.
Initial download of the metrics may take a while.