Fig. 5.
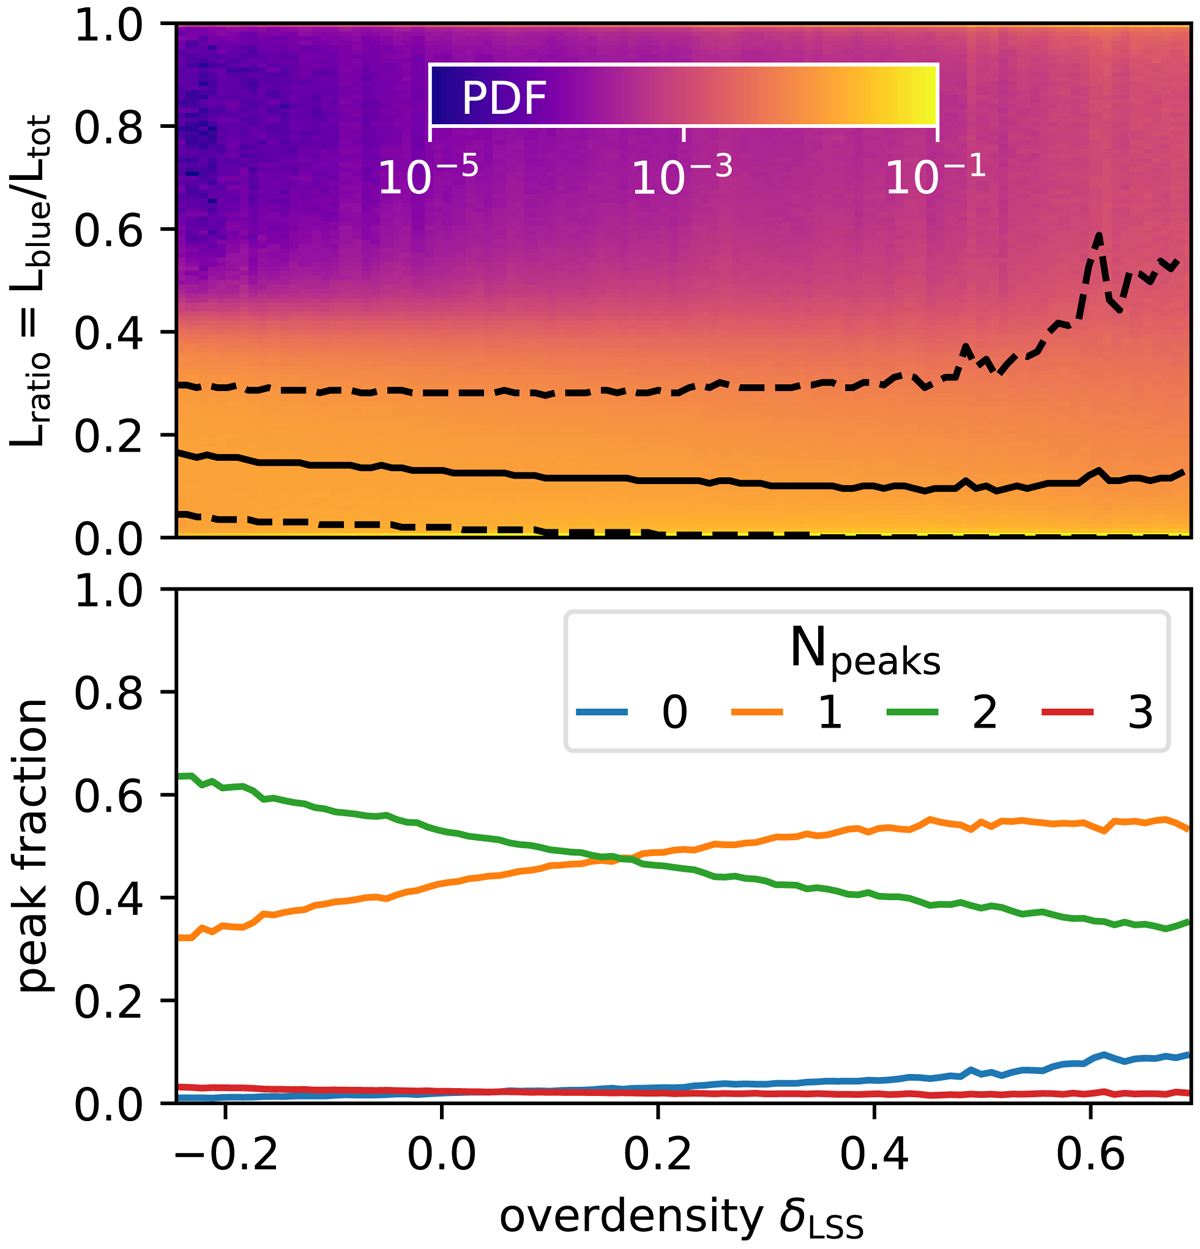
Lratio and Npeaks statistics shown as a function of the large scale overdensity δLSS at redshift z = 4.0. The input spectrum is the Neufeld solution. The colormap in the upper panel shows the underlying PDF normalized at a given δLSS. Overdense regions overall decrease Lratio. At a higher overdensity, this trend halts as the ratio becomes more fluctuating for different LOS. For the peak fractions, we find a gradual decrease of double peaks. This is caused by absorption features on the blue side of the line-center. Thus, the decrease of double peaks is strongly correlated with the increase of the fraction of single peaked spectra.
Current usage metrics show cumulative count of Article Views (full-text article views including HTML views, PDF and ePub downloads, according to the available data) and Abstracts Views on Vision4Press platform.
Data correspond to usage on the plateform after 2015. The current usage metrics is available 48-96 hours after online publication and is updated daily on week days.
Initial download of the metrics may take a while.