Fig. 4.
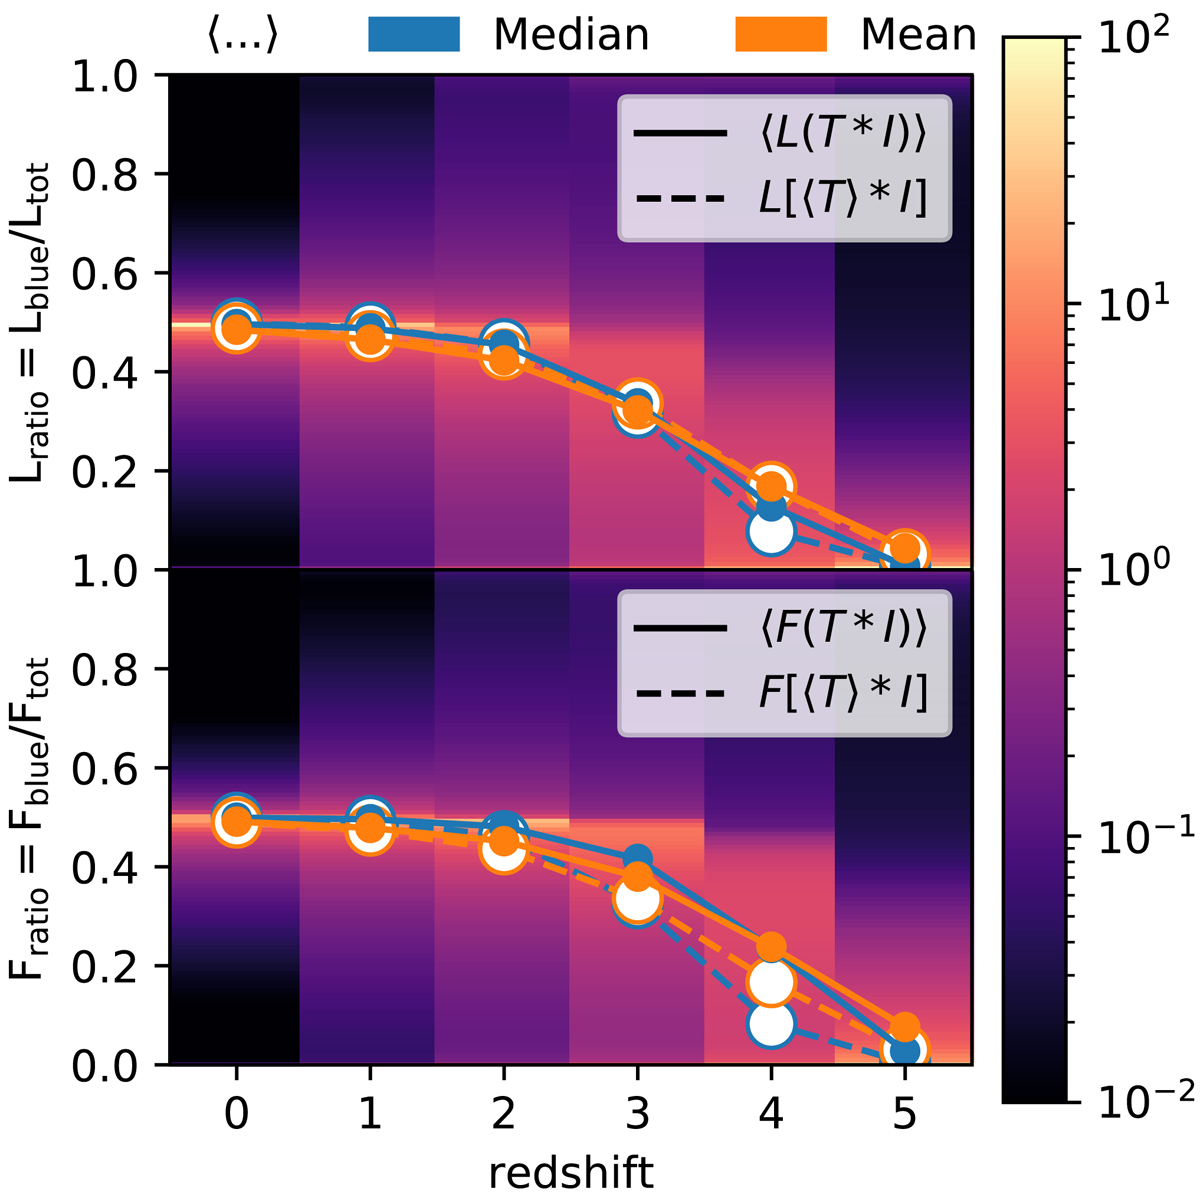
Ratios Lratio (top) and Fratio (bottom) shown as a PDF over all lines of sight for both all directions and emitters at a given redshift as shown by the colormap. We chose the double peaked input spectrum, but we also find a very similar result for the centrally peaked input spectrum. The four overplotted lines in each panel show different averaging methods (see text). We assume that no peak can be detected (hence no ratio) when the flux remaining after passing the IGM is less than 1% of the intrinsic flux I(λ).
Current usage metrics show cumulative count of Article Views (full-text article views including HTML views, PDF and ePub downloads, according to the available data) and Abstracts Views on Vision4Press platform.
Data correspond to usage on the plateform after 2015. The current usage metrics is available 48-96 hours after online publication and is updated daily on week days.
Initial download of the metrics may take a while.