Fig. 2.
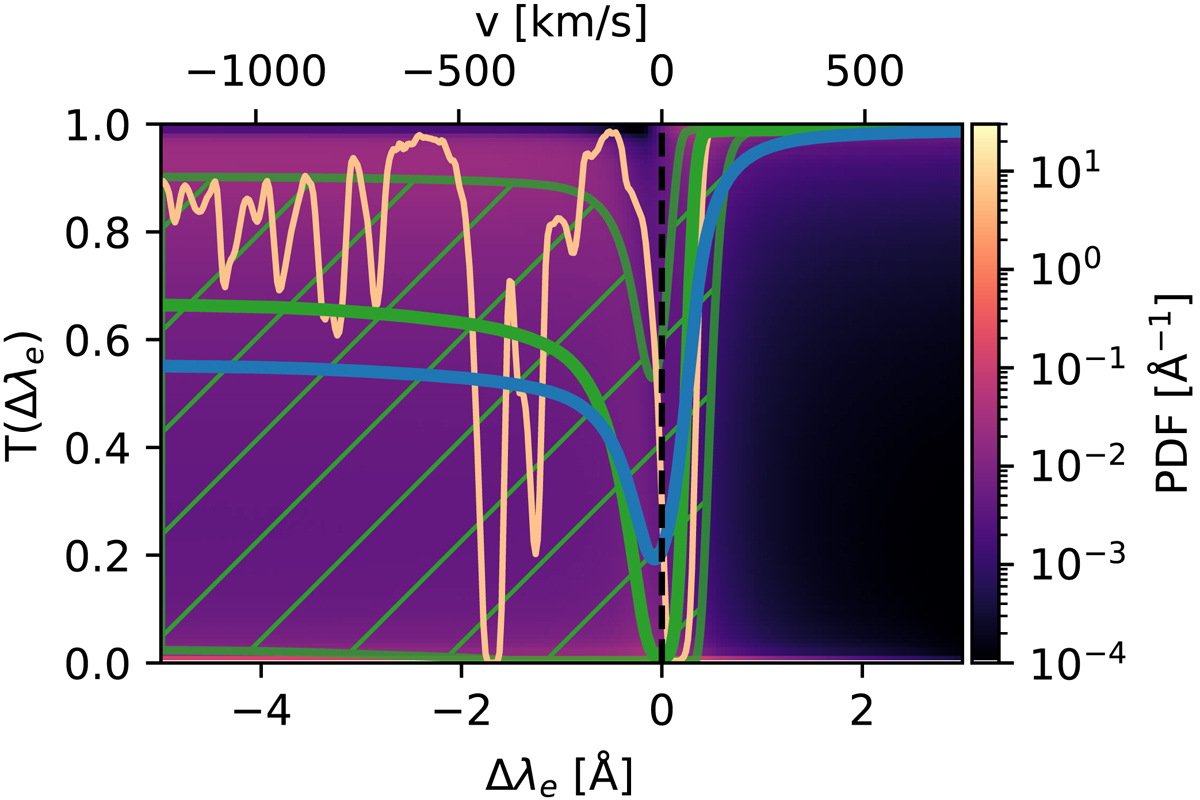
PDF of the transmission, T, as a function input wavelength shift, Δλe, over all emitters and the LOS at z = 3. Green line shows the median transmission with the hatched region enclosing the central 68% of all individual transmission curves, while the blue line shows the mean transmission curve over this PDF. The light orange curve shows an example of an individual LOS (corresponding to “LOS 1” in Fig. 1).
Current usage metrics show cumulative count of Article Views (full-text article views including HTML views, PDF and ePub downloads, according to the available data) and Abstracts Views on Vision4Press platform.
Data correspond to usage on the plateform after 2015. The current usage metrics is available 48-96 hours after online publication and is updated daily on week days.
Initial download of the metrics may take a while.