Fig. 1.
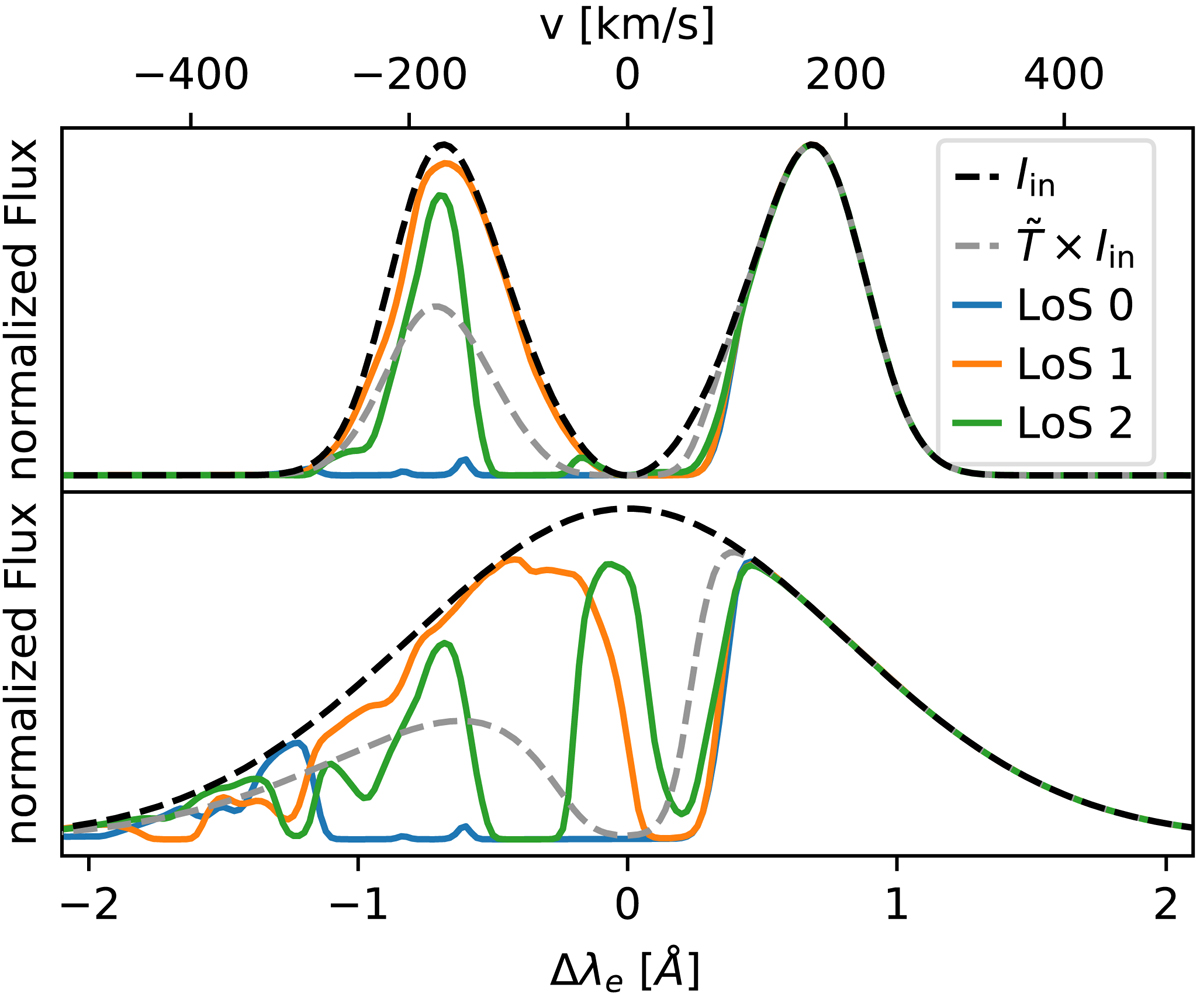
Panels showing two different input (i.e., intrinsic) spectra (black lines) and how the IGM attenuation shapes the observed spectra along different LOS at z = 3.0. All spectra are normalized by the respective underlying input spectrum’s total flux. The gray dashed line shows the multiplication of the respective input spectrum with the median transmission curve, ![]() , for all emitters and LOS at the given redshift. The colored solid lines show observed spectra for the same emitter but for different LOS. Wavelengths are evaluated in the halo’s rest-frame. Top: input spectrum obtained as analytic solution of a spherical hydrogen distribution with a column density N = 1020 cm−2 and temperature T = 104 K (Dijkstra et al. 2006). Bottom: with a Gaussian intrinsic spectrum with standard deviation σ = 200 km s−1.
, for all emitters and LOS at the given redshift. The colored solid lines show observed spectra for the same emitter but for different LOS. Wavelengths are evaluated in the halo’s rest-frame. Top: input spectrum obtained as analytic solution of a spherical hydrogen distribution with a column density N = 1020 cm−2 and temperature T = 104 K (Dijkstra et al. 2006). Bottom: with a Gaussian intrinsic spectrum with standard deviation σ = 200 km s−1.
Current usage metrics show cumulative count of Article Views (full-text article views including HTML views, PDF and ePub downloads, according to the available data) and Abstracts Views on Vision4Press platform.
Data correspond to usage on the plateform after 2015. The current usage metrics is available 48-96 hours after online publication and is updated daily on week days.
Initial download of the metrics may take a while.