Fig. 7.
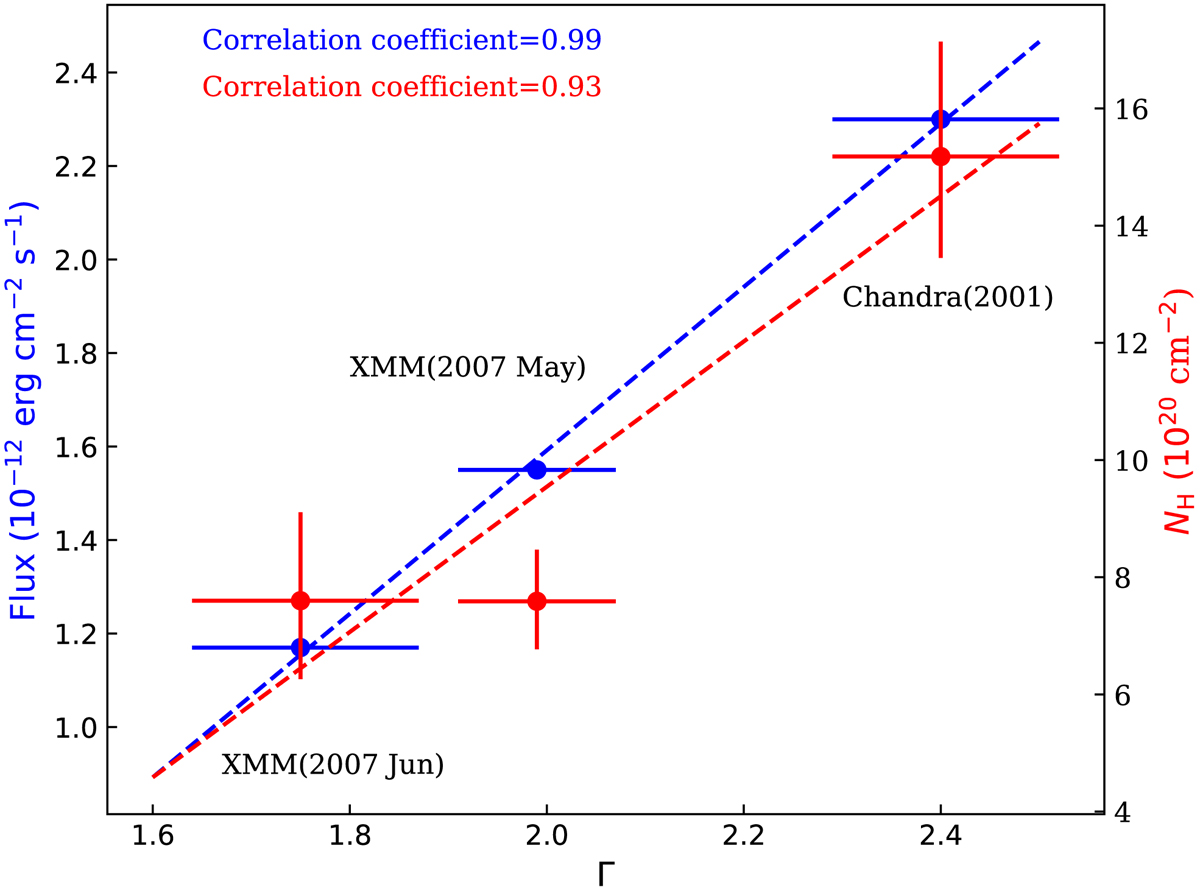
Unabsorbed 0.3–10 keV flux and hydrogen column density versus photon index obtained from MCD+PL model fit. The correlation between F(0.3 − 10) keV and Γ is shown in blue, while correlation between NH and Γ is shown red. The data points were fitted with a linear model and the best-fit model is represented by the dashed lines in the plot.
Current usage metrics show cumulative count of Article Views (full-text article views including HTML views, PDF and ePub downloads, according to the available data) and Abstracts Views on Vision4Press platform.
Data correspond to usage on the plateform after 2015. The current usage metrics is available 48-96 hours after online publication and is updated daily on week days.
Initial download of the metrics may take a while.