Fig. 5.
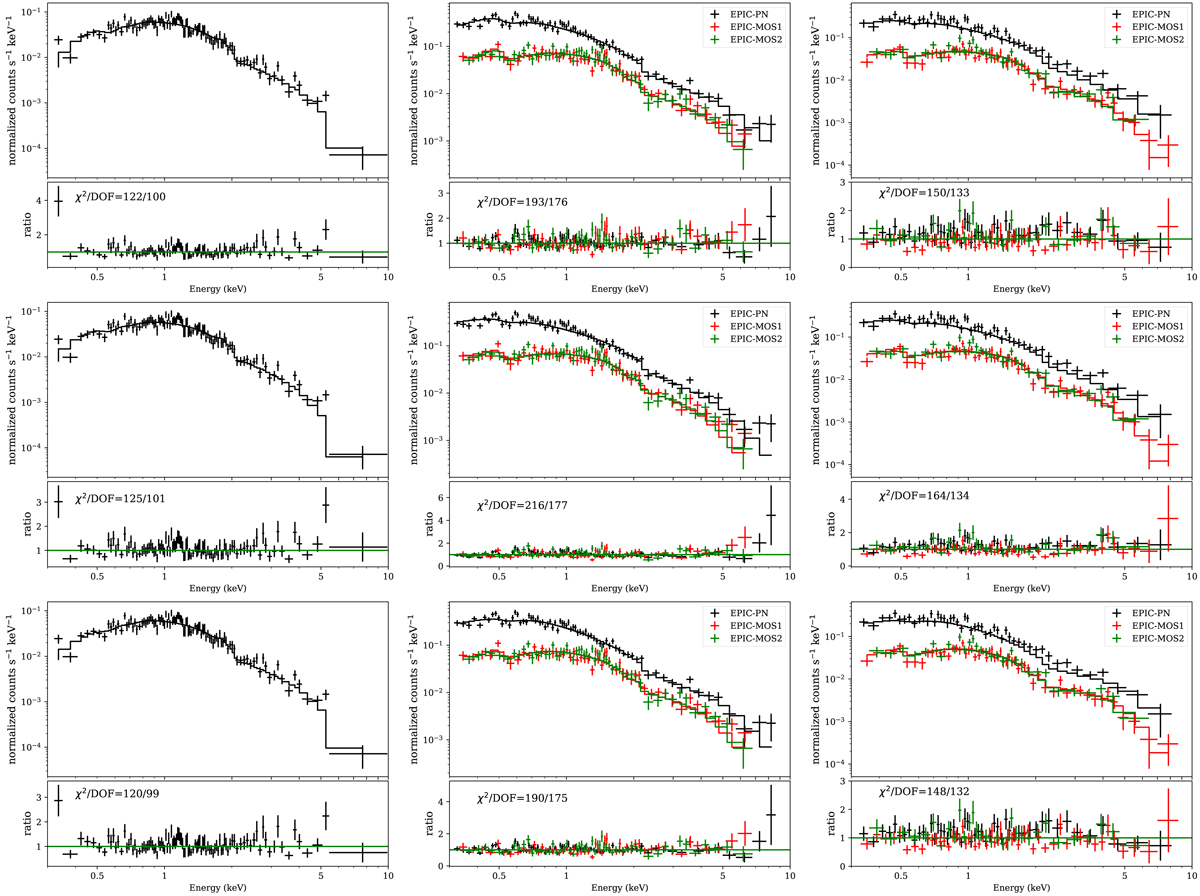
Each subplot shows the data with the folded model in the upper panel and the data-to-model ratio in the lower panel. In the first row, results from the fit of the MCD+PL model are presented, in the second row the DISKPBB model, and, finally, in the third row we have MCD+NTHCOMP. The different columns correspond to Chandra data in the left column, XMM-Newton 2007-05-28 data in the middle column, and 2007-06-19 data in the right column.
Current usage metrics show cumulative count of Article Views (full-text article views including HTML views, PDF and ePub downloads, according to the available data) and Abstracts Views on Vision4Press platform.
Data correspond to usage on the plateform after 2015. The current usage metrics is available 48-96 hours after online publication and is updated daily on week days.
Initial download of the metrics may take a while.