Free Access
Fig. 3.
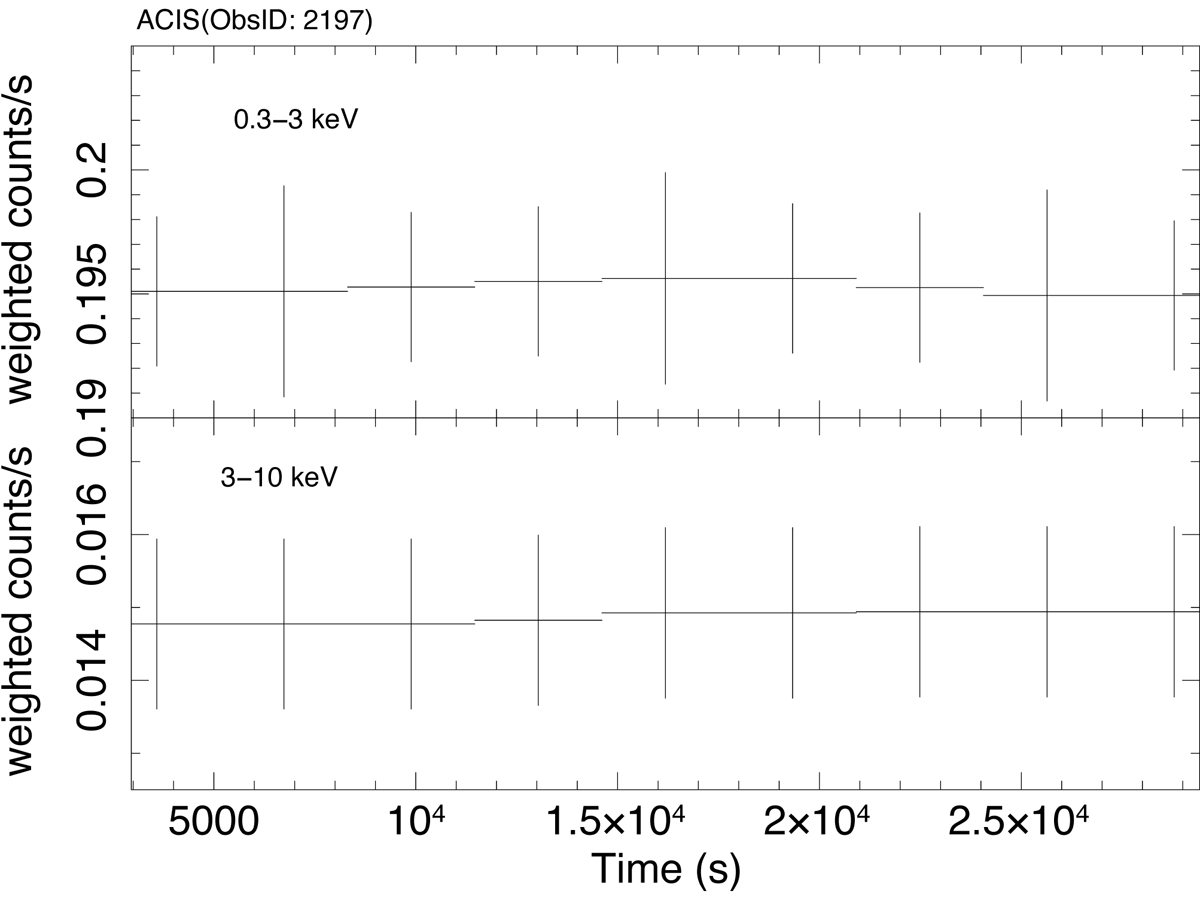
Chandra observation probability-weighted light curves, as obtained from the CIAO glvary tool, i.e. after taking account all instrumental effects. The zero time corresponds to 2001-08-27 02:13:48. The total probability of variability for the 0.3–3 keV and 3–10 keV light curves is 0.02 and 0.07, respectively (see Sect. 3).
Current usage metrics show cumulative count of Article Views (full-text article views including HTML views, PDF and ePub downloads, according to the available data) and Abstracts Views on Vision4Press platform.
Data correspond to usage on the plateform after 2015. The current usage metrics is available 48-96 hours after online publication and is updated daily on week days.
Initial download of the metrics may take a while.