Fig. 2.
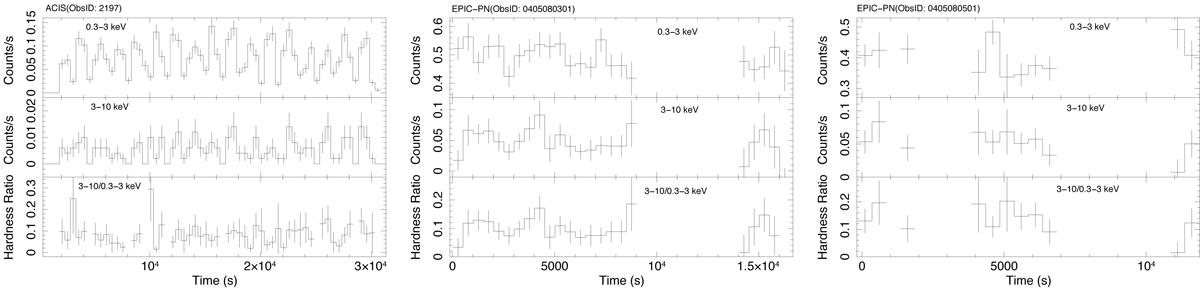
Chandra ACIS-S and XMM-Newton EPIC-PN light curves of NGC 5055 X-1 for the three observations at different epochs (observation IDs are indicated in each panel). Soft 0.3–3 keV and hard 3–10 keV energy band light curves are shown in the upper and middle panels, respectively, while the bottom panels show the hardness ratios for each set of data. All the light curves are re-binned with bin size 500 s to have higher S/N. The zero times in the plots correspond to 2001-08-27 02:13:48, 2007-05-28 07:59:14, and 2007-06-19 10:56:29 for panels from left to right, respectively.
Current usage metrics show cumulative count of Article Views (full-text article views including HTML views, PDF and ePub downloads, according to the available data) and Abstracts Views on Vision4Press platform.
Data correspond to usage on the plateform after 2015. The current usage metrics is available 48-96 hours after online publication and is updated daily on week days.
Initial download of the metrics may take a while.