Fig. 1.
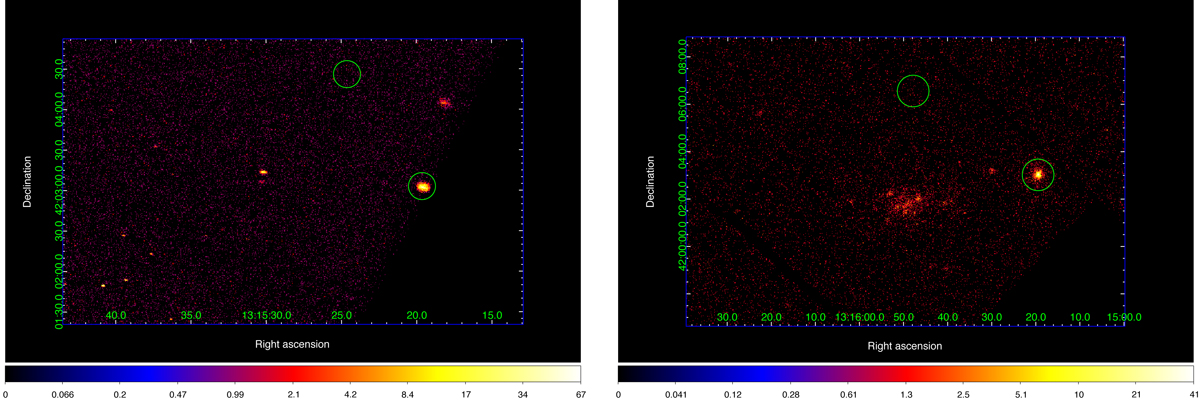
X-ray image in counts per pixel displays the field of view of Chandra ACIS-S (left panel) and XMM-Newton EPIC-MOS1 (2007-05-28; right panel) detectors. The green circles containing bright pixels show NGC 5055 X-1, while the empty green circles represent the region from where the background was extracted. Chandra spatial resolution allowed us to extract source photons from a circular region of 6″ radius, while for XMM-Newton we used circular regions of 40″.
Current usage metrics show cumulative count of Article Views (full-text article views including HTML views, PDF and ePub downloads, according to the available data) and Abstracts Views on Vision4Press platform.
Data correspond to usage on the plateform after 2015. The current usage metrics is available 48-96 hours after online publication and is updated daily on week days.
Initial download of the metrics may take a while.