Fig. 9.
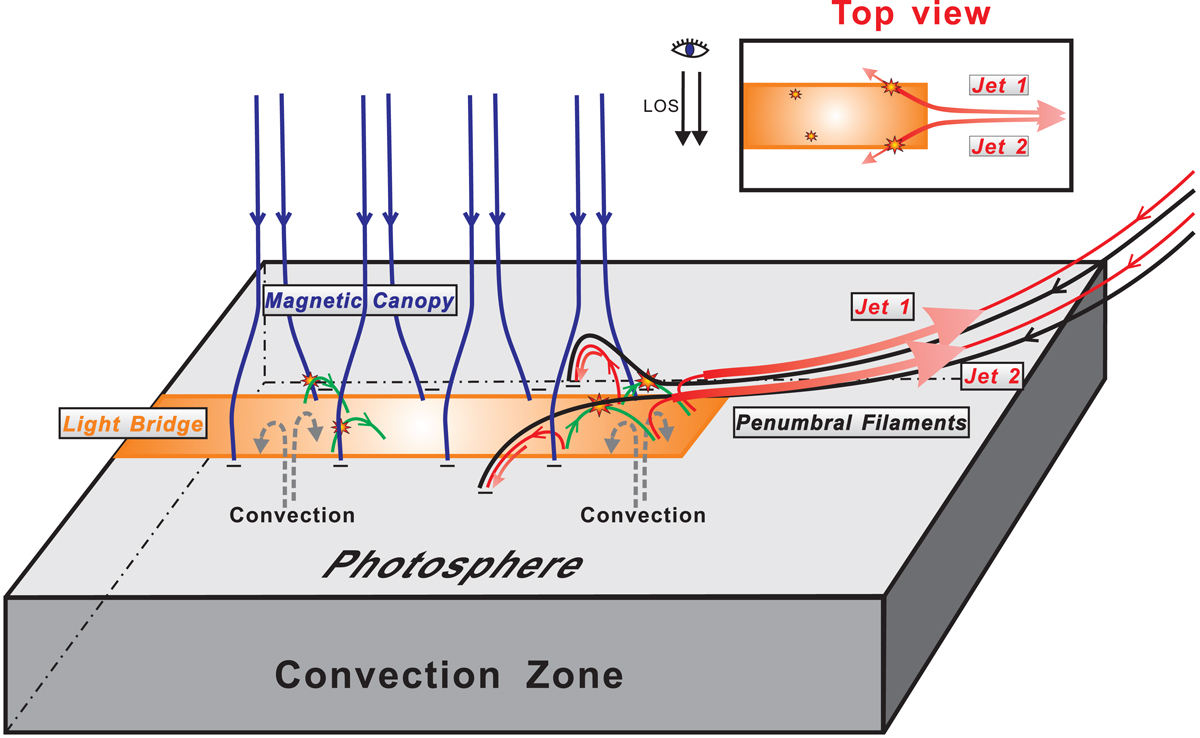
Sketch illustrating the formation of the jets caused by the sunspot penumbral filament intrusions into the sunspot light bridge. The orange rectangle approximates mapping of the light bridge on the photosphere (indicated by the upper surface of a gray cube). The green curves represent emerging magnetic fields within the light bridge. Umbral magnetic fields surrounding the light bridge are denoted by the navy blue curves and resemble a magnetic canopy. The black curves delineate the magnetic fields of the penumbral filaments intruding into the umbrae on two sides of the light bridge. The star symbols mark the sites of magnetic reconnection. The red curves denote newly formed magnetic fields due to the reconnection occurring between the emerging fields within the light bridge and the highly inclined fields of the intruding filaments, along which downward flows and two groups of upward jets (jet1 and jet2) are observed.
Current usage metrics show cumulative count of Article Views (full-text article views including HTML views, PDF and ePub downloads, according to the available data) and Abstracts Views on Vision4Press platform.
Data correspond to usage on the plateform after 2015. The current usage metrics is available 48-96 hours after online publication and is updated daily on week days.
Initial download of the metrics may take a while.