Fig. 8.
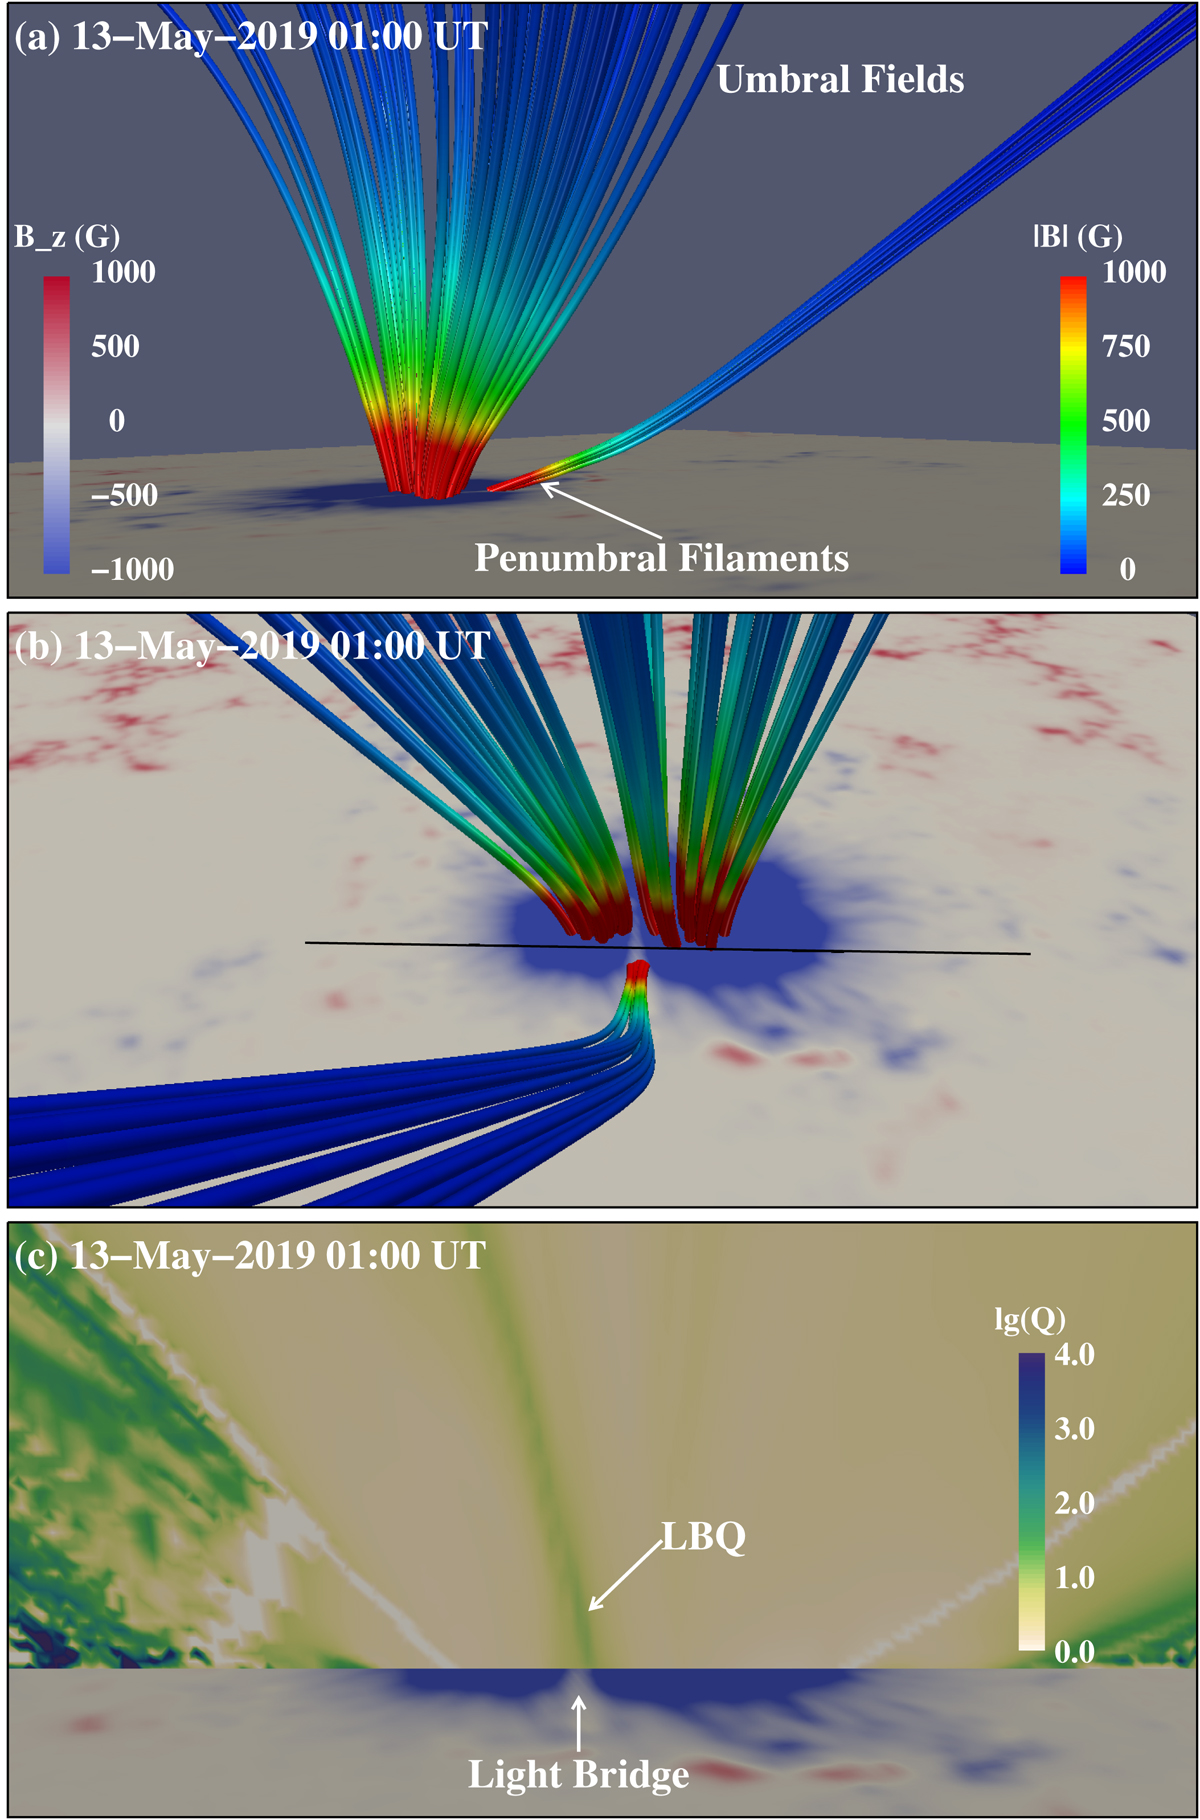
3D magnetic topology of the sunspot penumbral filaments intruding into the light bridge revealed by NLFFF extrapolation at 01:00 UT on 2019 May 13. Panels a and b: intruding filaments and sunspot umbral fields from a side view and a top view, respectively. Panel c: displays logarithmic Q distribution in the vertical plane based on the black cut denoted in (panel b), which distinctly depicts the high-Q region above the light bridge (LBQ).
Current usage metrics show cumulative count of Article Views (full-text article views including HTML views, PDF and ePub downloads, according to the available data) and Abstracts Views on Vision4Press platform.
Data correspond to usage on the plateform after 2015. The current usage metrics is available 48-96 hours after online publication and is updated daily on week days.
Initial download of the metrics may take a while.