Fig. 6.
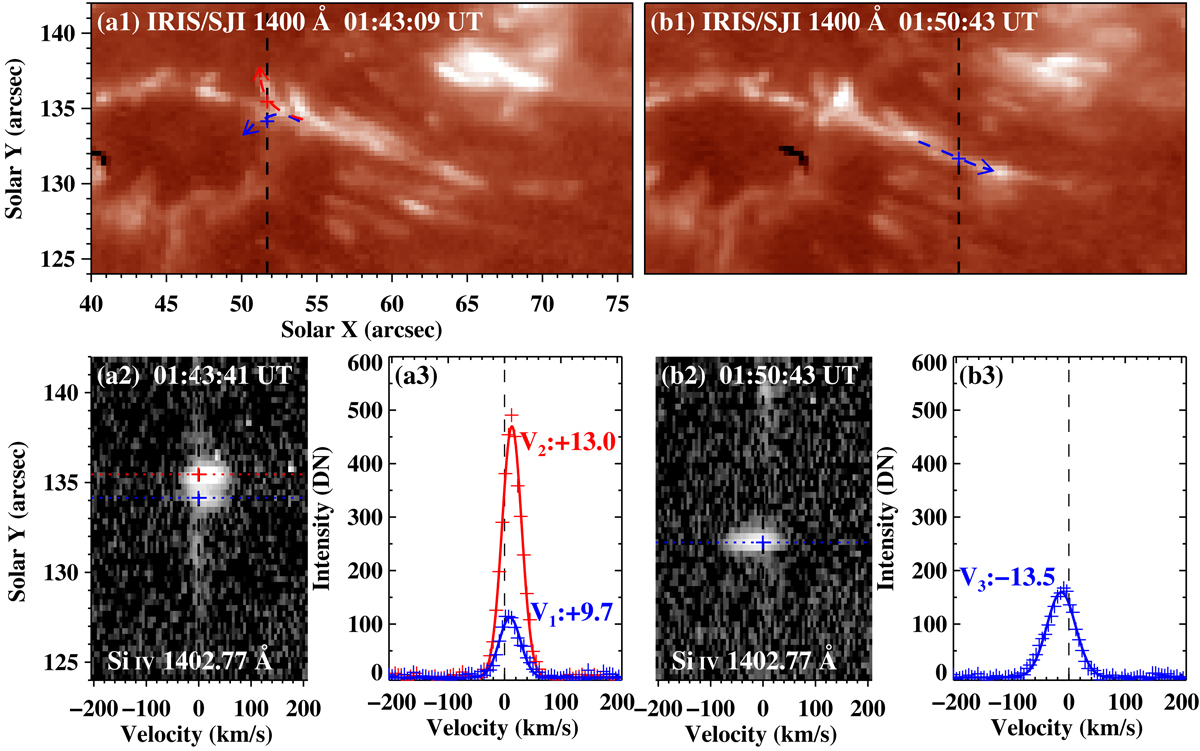
Analysis of IRIS Si IV 1402.77 Å line for the jets with two directions. a1–a3: spectral analysis of the jets toward the solar surface. The black vertical line in (a1) marks the location of spectrograph slit at 01:43:41 UT, and the arrows denote the directions of downward jet flows cross the slit. Panel a2: Si IV 1402.77 Å line spectra along the slit. Panel a3: exhibits the Si IV 1402.77 Å line profiles (plus signs) and their single-Gaussian fitting profiles (solid curves) at positions indicated by the blue and red plus signs (dotted lines) shown in (a2). b1–b3: Similar to (a1)–(a3), but for the jets ejecting upward.
Current usage metrics show cumulative count of Article Views (full-text article views including HTML views, PDF and ePub downloads, according to the available data) and Abstracts Views on Vision4Press platform.
Data correspond to usage on the plateform after 2015. The current usage metrics is available 48-96 hours after online publication and is updated daily on week days.
Initial download of the metrics may take a while.