Fig. 5.
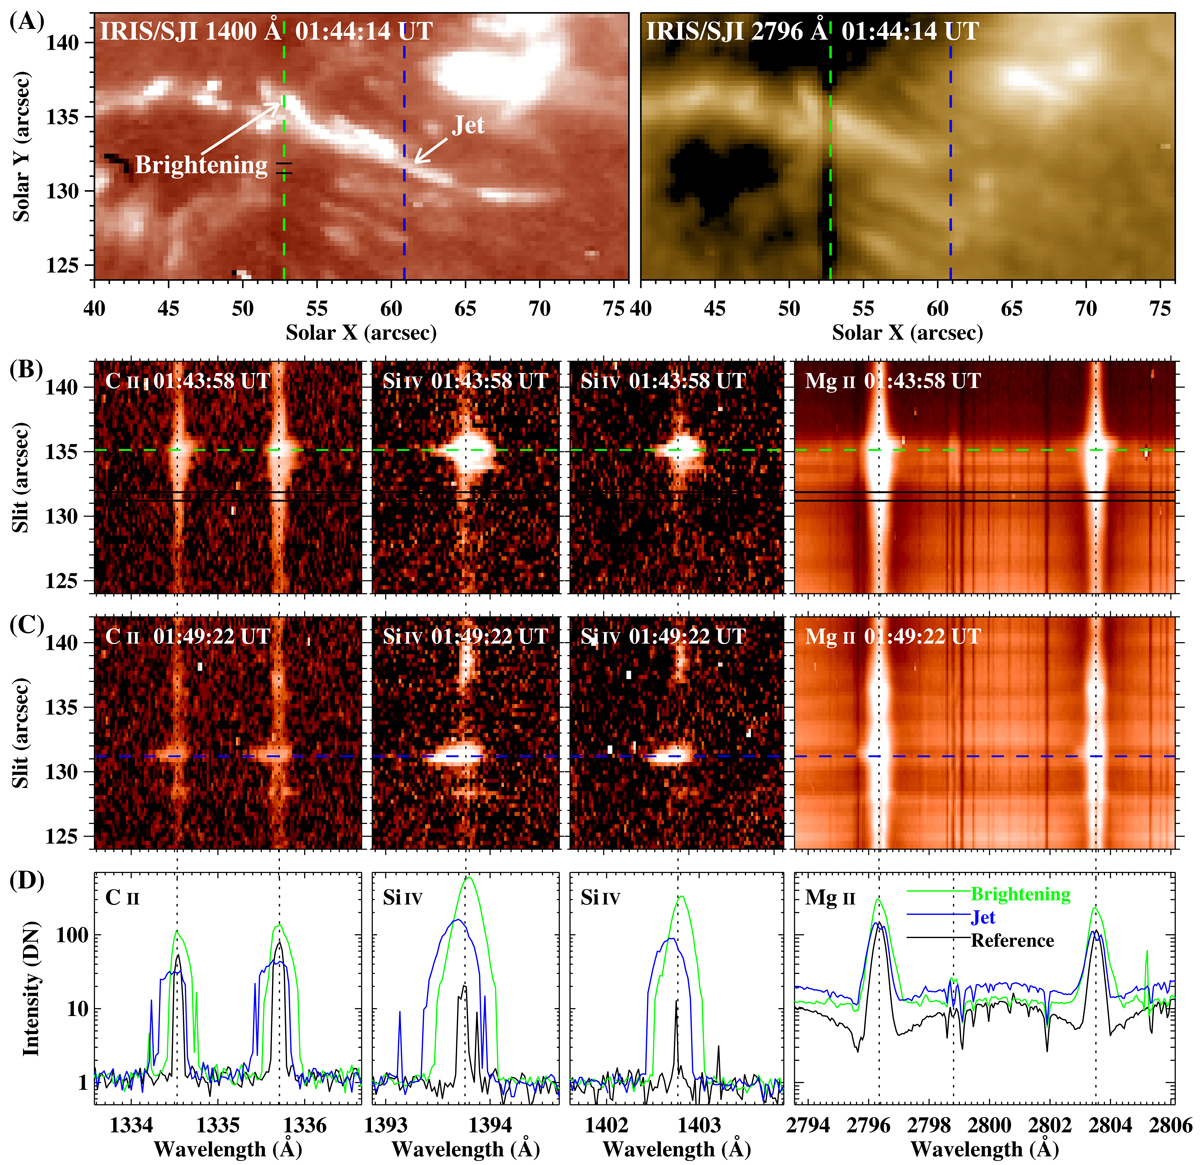
IRIS spectral observations of the jets and jet-base brightening. A: IRIS 1400 Å and 2796 Å images. The green and blue vertical dashed lines mark the positions of the spectrograph slit at 01:43:58 UT and 01:49:22 UT, respectively. B–C: spectral Detector images taken through the spectrograph slit at the positions shown in (A). D: IRIS spectral line profiles along the green horizontal dashed line in (B) at the jet-base brightening and the blue line in (C) at the jet indicated by the arrows in (A). The reference line profiles are obtained by averaging the spectra within the section between the two black horizontal lines in (B) (also see the black bars in (A)). Here the intensities of profiles in the Mg II window are all divided by ten.
Current usage metrics show cumulative count of Article Views (full-text article views including HTML views, PDF and ePub downloads, according to the available data) and Abstracts Views on Vision4Press platform.
Data correspond to usage on the plateform after 2015. The current usage metrics is available 48-96 hours after online publication and is updated daily on week days.
Initial download of the metrics may take a while.