Fig. 4.
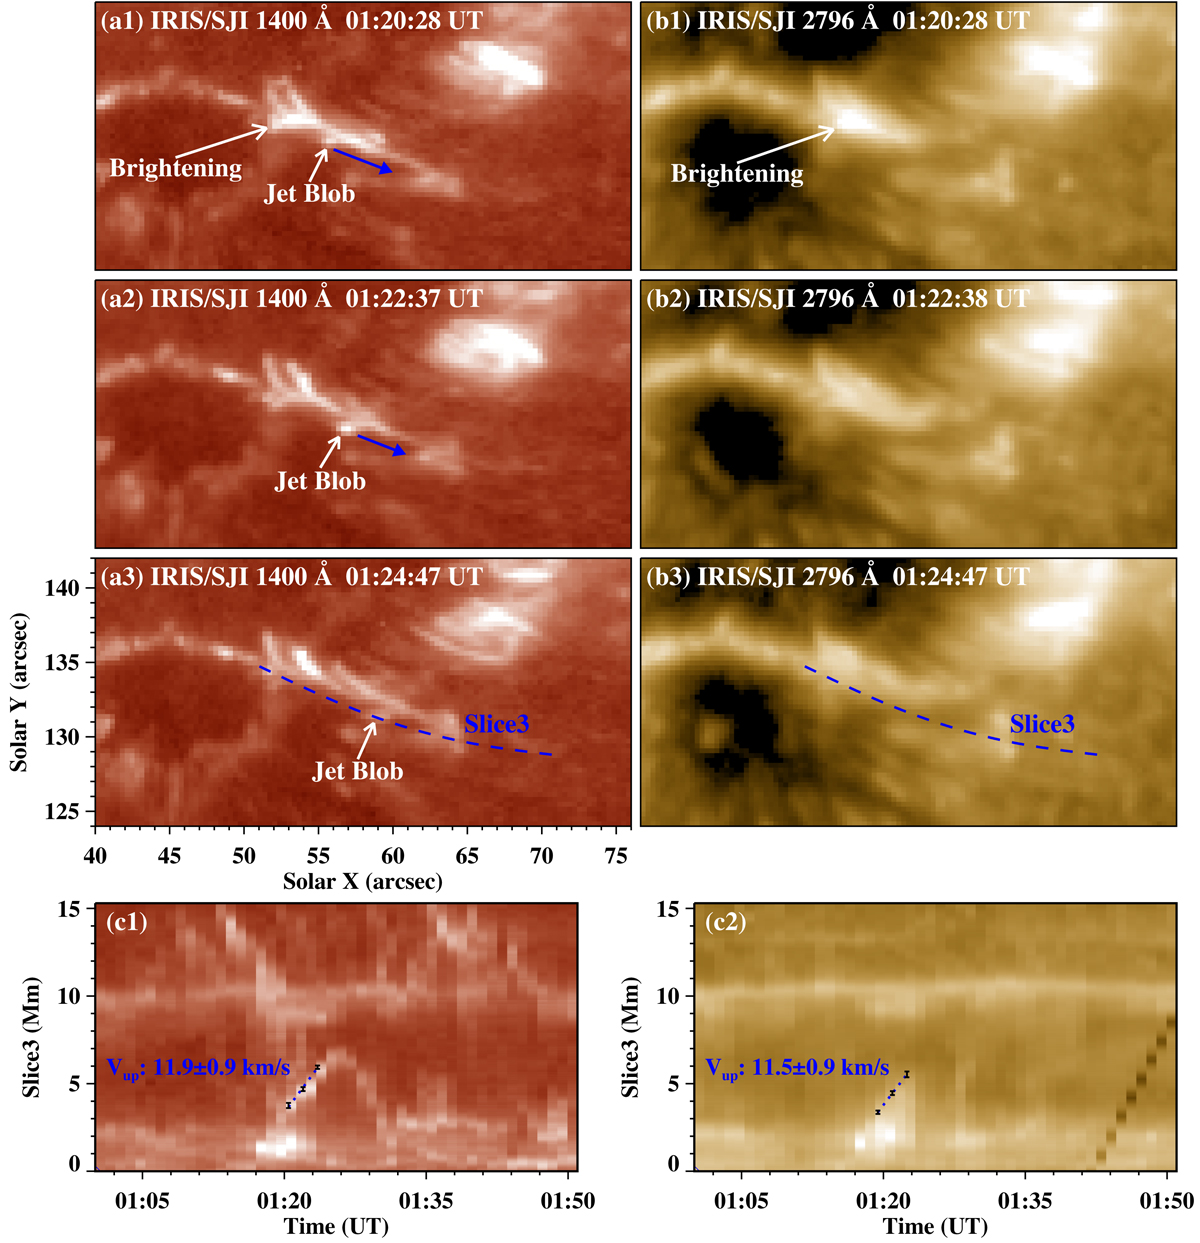
Kinematic characteristics of the jets revealed by the IRIS observations. (a1)–(a3): sequence of 1400 Å images exhibiting the bright blob-like feature moving along the jet. The blue solid arrow in panel c denotes the ejecting direction of the bright blob. The dashed curve “Slice3” approximates the projected trajectory of bright blob. b1–b3: Corresponding 2796 Å images. (c1)–(c2): time-distance plots along the curve “Slice3” in 1400 Å and 2796 Å channels. The dotted oblique lines delineate linear fittings of projected trajectory of the bright blob in the rising phase. An animation (figure4.mov) of 1400 Å and 2796 Å channels, covering 00:40 UT to 01:51 UT, is available online.
Current usage metrics show cumulative count of Article Views (full-text article views including HTML views, PDF and ePub downloads, according to the available data) and Abstracts Views on Vision4Press platform.
Data correspond to usage on the plateform after 2015. The current usage metrics is available 48-96 hours after online publication and is updated daily on week days.
Initial download of the metrics may take a while.