Fig. 3.
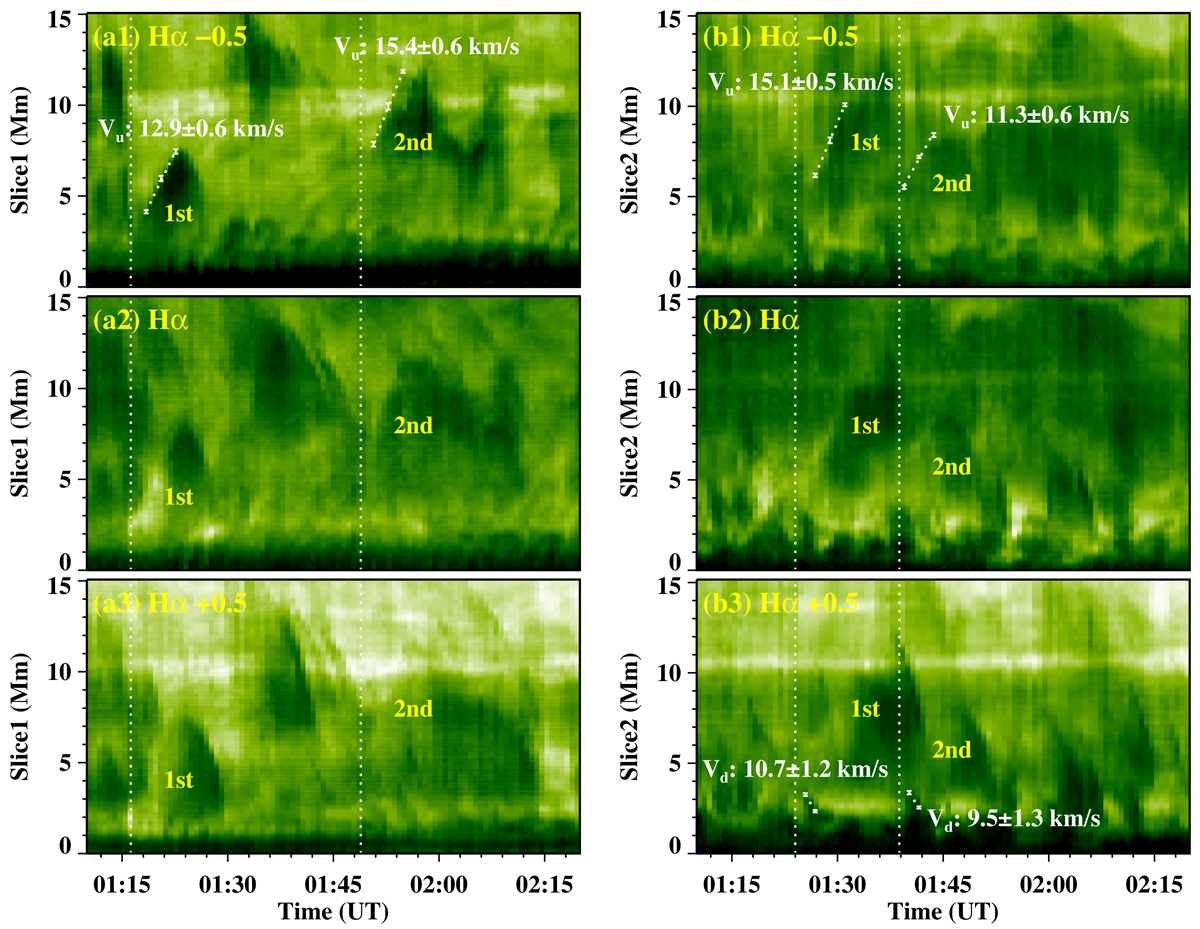
Kinematic characteristics of the jets revealed by the NVST Hα observations. a1–a3: time–distance plots derived from the Hα blue wing, line core, and red wing images along the curve “Slice1” shown in Fig. 2a3. The dotted vertical lines mark the initial moments of two rising phases. The dotted oblique lines delineate linear fittings of the front of jet1 in two rising phases. b1–b3: similar to (a1)–(a3), but showing jet2 along the curve “Slice2”.
Current usage metrics show cumulative count of Article Views (full-text article views including HTML views, PDF and ePub downloads, according to the available data) and Abstracts Views on Vision4Press platform.
Data correspond to usage on the plateform after 2015. The current usage metrics is available 48-96 hours after online publication and is updated daily on week days.
Initial download of the metrics may take a while.