Fig. 2.
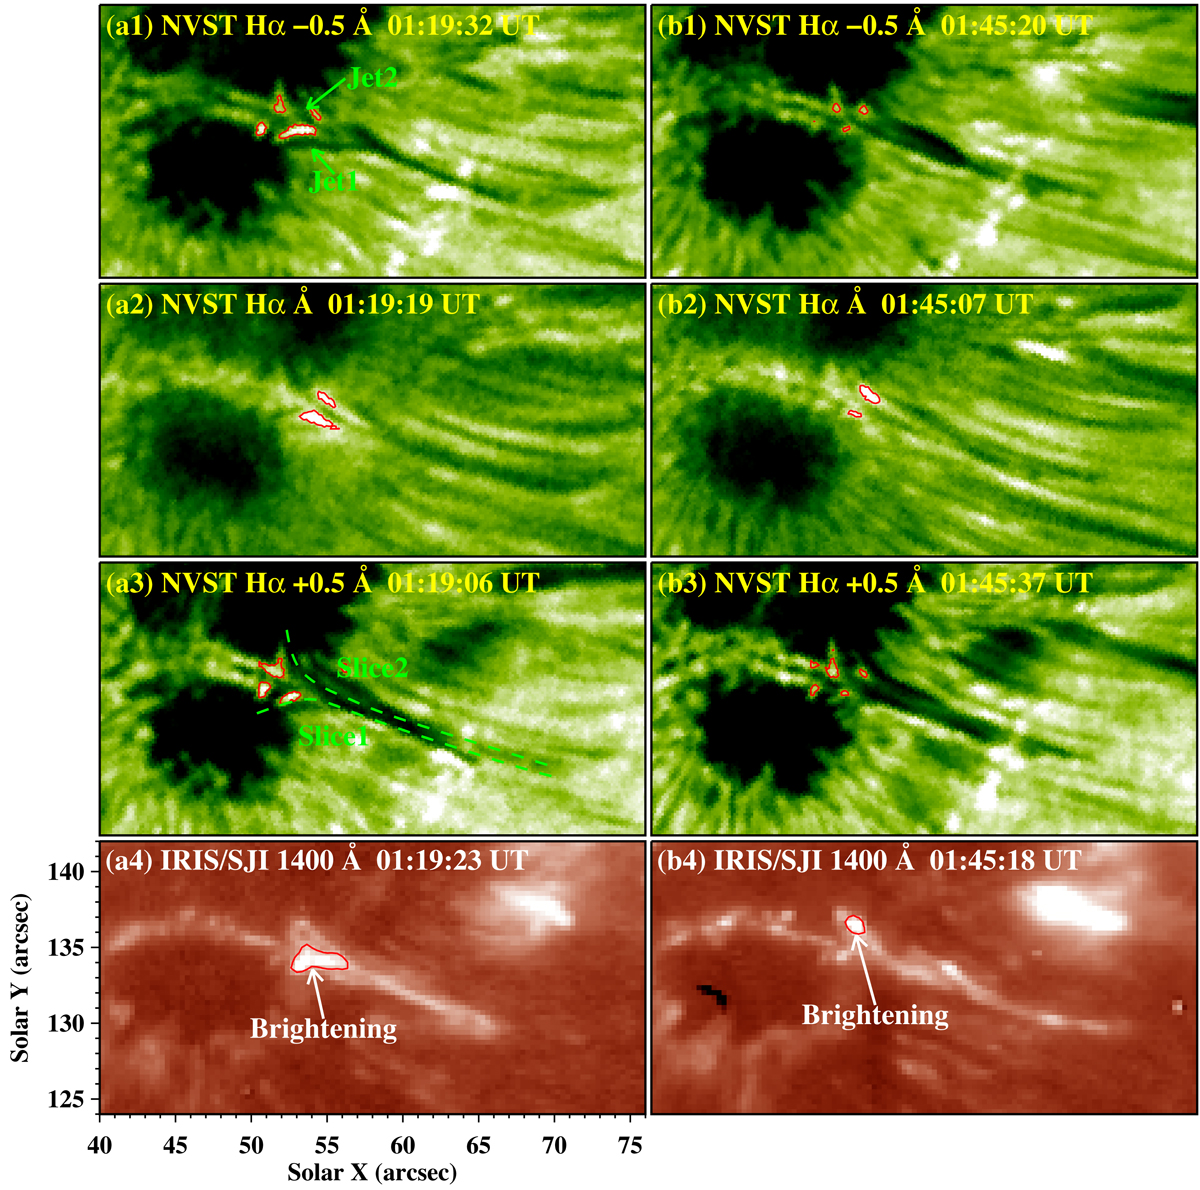
Intermittent brightenings near the jet bases. a1–a4: NVST Hα blue wing image (Δλ = −0.5 Å), core image, red wing image (Δλ = +0.5 Å), and IRIS 1400 Å image showing the jets and associated brightenings (see the red contours) near the jet bases around 01:19 UT. The curves “Slice1” and “Slice2” in panel a3 approximate the projected trajectory of jet1 and jet2, respectively. b1–b4: similar to (a1)–(a4), but for the time point of 01:45 UT. An associated animation (figure2.mov) of Hα blue wing, core, and red wing images, covering 01:00 UT to 02:28 UT, is available online.
Current usage metrics show cumulative count of Article Views (full-text article views including HTML views, PDF and ePub downloads, according to the available data) and Abstracts Views on Vision4Press platform.
Data correspond to usage on the plateform after 2015. The current usage metrics is available 48-96 hours after online publication and is updated daily on week days.
Initial download of the metrics may take a while.