Fig. 1.
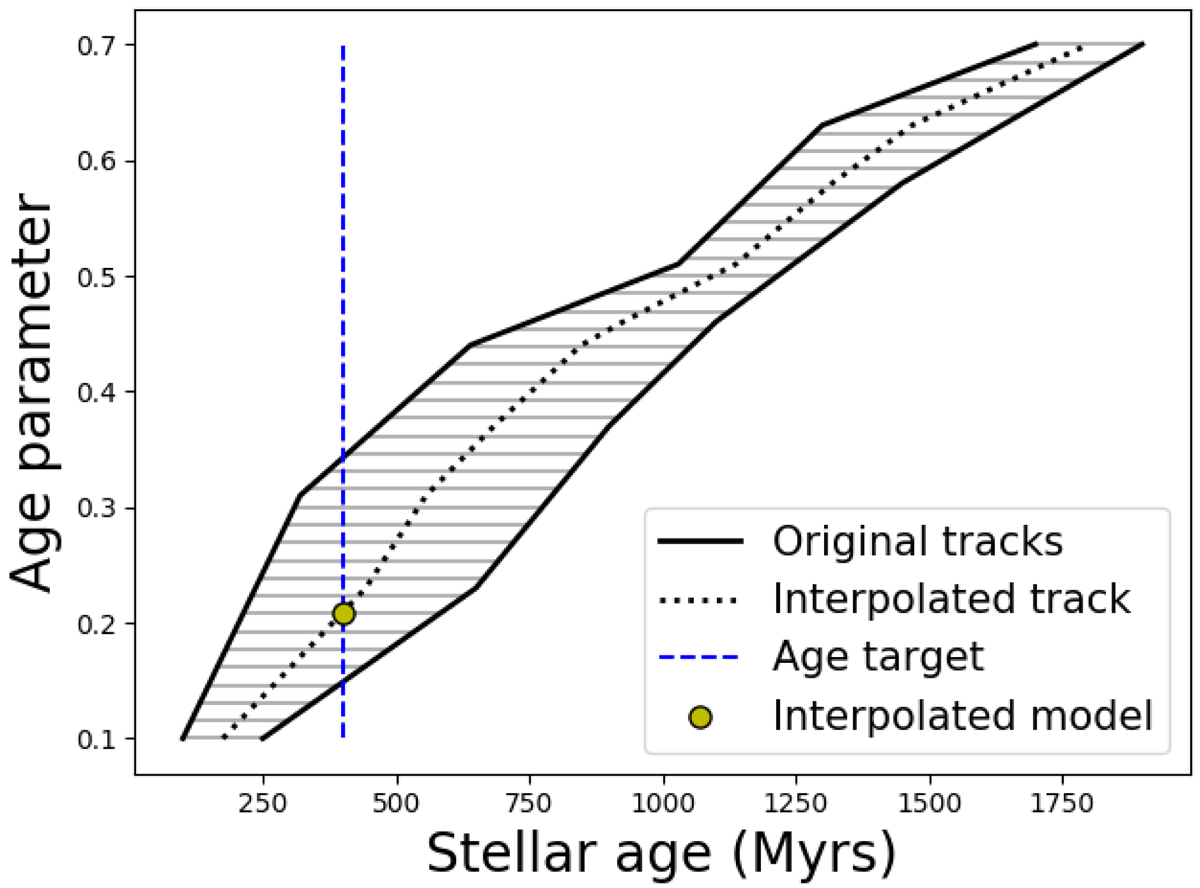
Schematic plot illustrating how age interpolation works in SPInS. The two solid lines correspond to two neighbouring stellar evolutionary tracks which are involved in the interpolation. The horizontal hatch marks indicate that the interpolation takes place horizontally (i.e. models with the same age parameter rather than physical age are linearly combined). The dotted line shows the interpolated track. The vertical blue dashed line corresponds to the target age and the yellow dot to the interpolated model.
Current usage metrics show cumulative count of Article Views (full-text article views including HTML views, PDF and ePub downloads, according to the available data) and Abstracts Views on Vision4Press platform.
Data correspond to usage on the plateform after 2015. The current usage metrics is available 48-96 hours after online publication and is updated daily on week days.
Initial download of the metrics may take a while.