Open Access
Fig. 5.
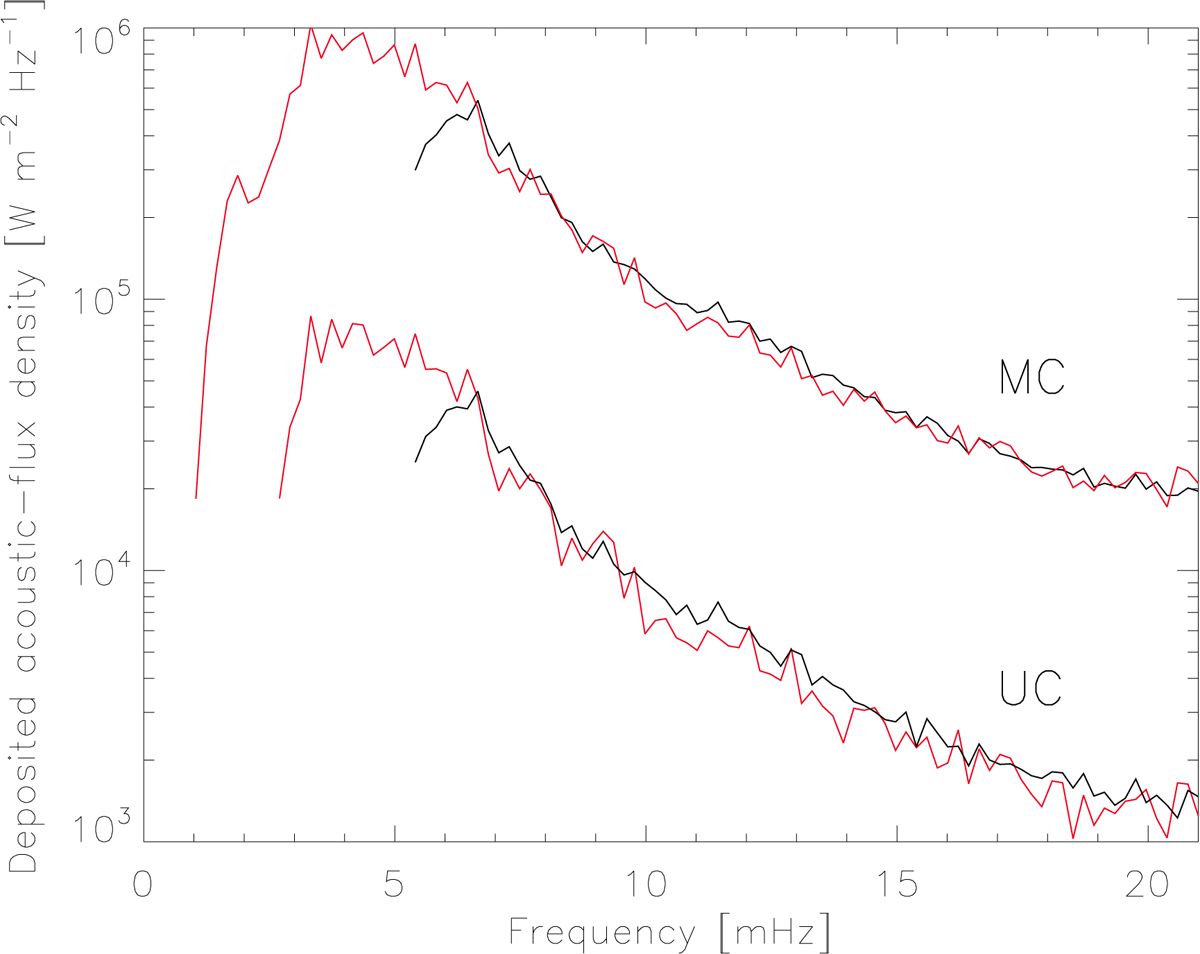
Frequency distribution of the deposited acoustic-flux density averaged over magnetic (red) and non-magnetic (black) areas of the October 3 data set. MC and UC lines correspond to the height ranges 1000–1400 km (middle chromosphere) and 1400–1800 km (upper chromosphere), respectively.
Current usage metrics show cumulative count of Article Views (full-text article views including HTML views, PDF and ePub downloads, according to the available data) and Abstracts Views on Vision4Press platform.
Data correspond to usage on the plateform after 2015. The current usage metrics is available 48-96 hours after online publication and is updated daily on week days.
Initial download of the metrics may take a while.