Fig. 4.
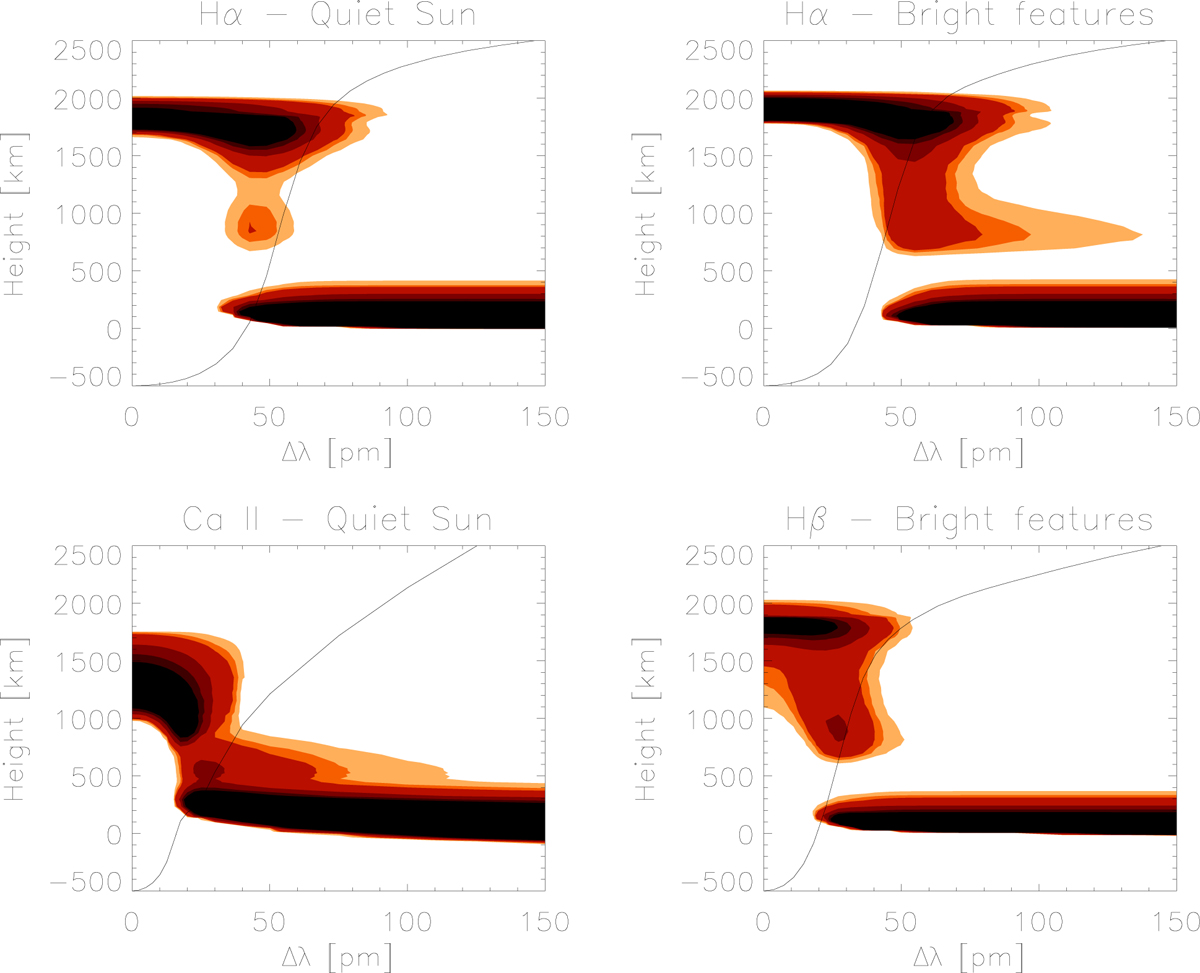
Contribution functions of the Hα, Hβ, and Ca II 854.2 nm lines for two typical models derived from our observations – quiet Sun (left) and bright chromospheric features (right). The colors change from light orange to black with increasing values of the contribution function. Black lines show corresponding synthetic line profiles.
Current usage metrics show cumulative count of Article Views (full-text article views including HTML views, PDF and ePub downloads, according to the available data) and Abstracts Views on Vision4Press platform.
Data correspond to usage on the plateform after 2015. The current usage metrics is available 48-96 hours after online publication and is updated daily on week days.
Initial download of the metrics may take a while.