Fig. 10.
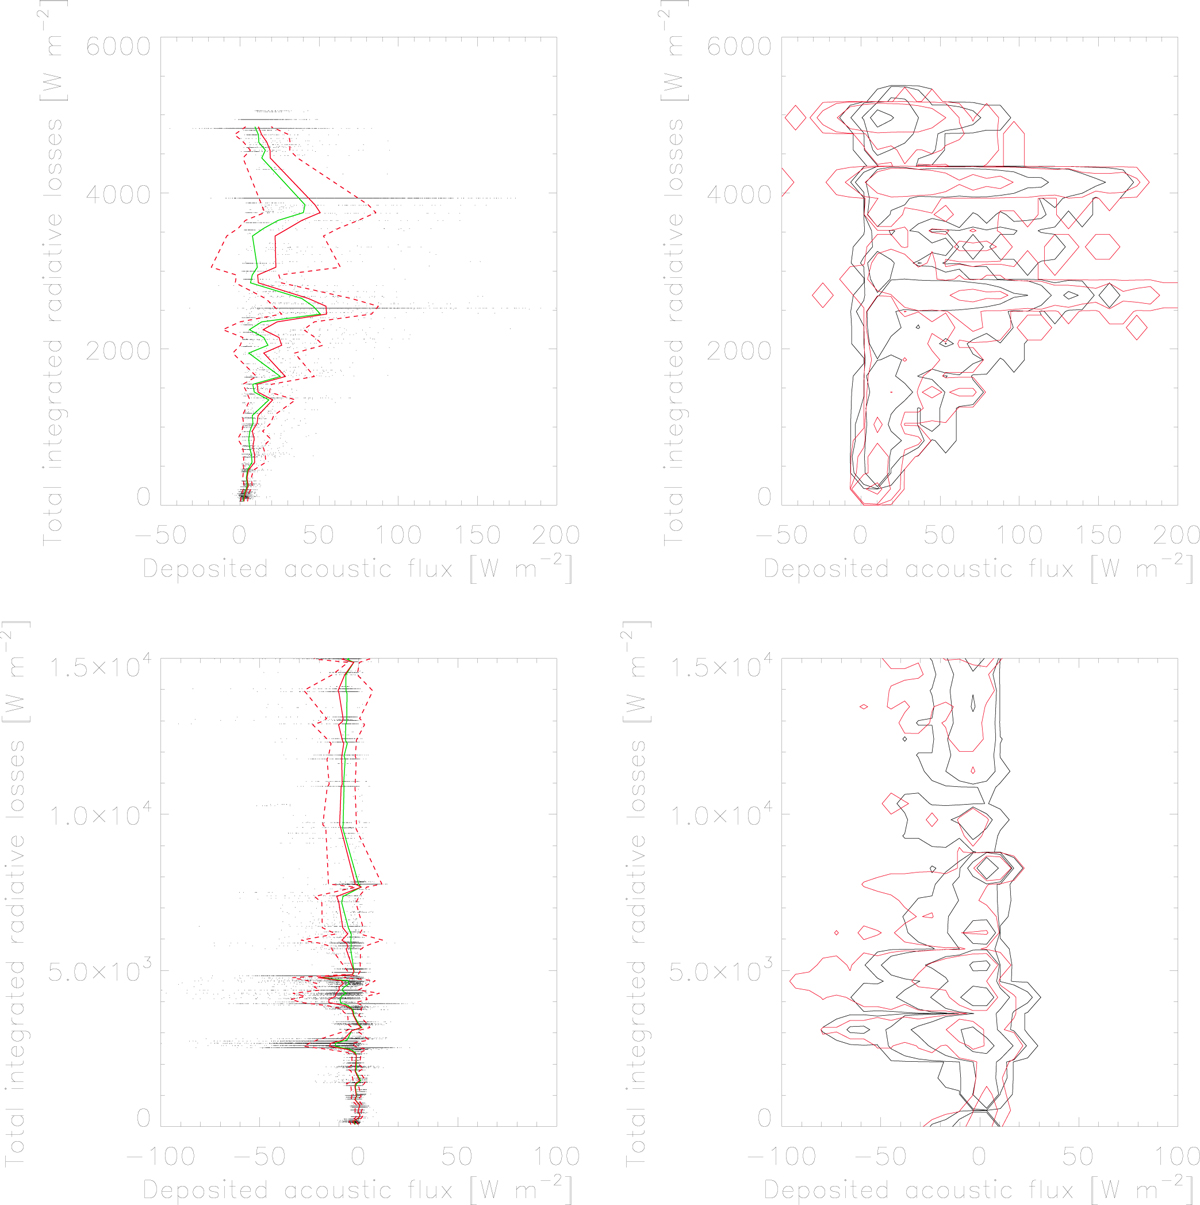
Left: scatter plots of total integrated radiative losses versus deposited acoustic flux for the range h = 1600–1900 km in the ROIs of December 11 (top) and June 6 (bottom). Solid lines show average (red) and median (green) values together with red dashed lines of ±1σ. Right: density contours of the scatter plots. Contours for magnetic (red) and non-magnetic (black) areas are plotted separately at density levels of 0.03, 0.3, 3, and 30% of a common density maximum.
Current usage metrics show cumulative count of Article Views (full-text article views including HTML views, PDF and ePub downloads, according to the available data) and Abstracts Views on Vision4Press platform.
Data correspond to usage on the plateform after 2015. The current usage metrics is available 48-96 hours after online publication and is updated daily on week days.
Initial download of the metrics may take a while.