Fig. 4.
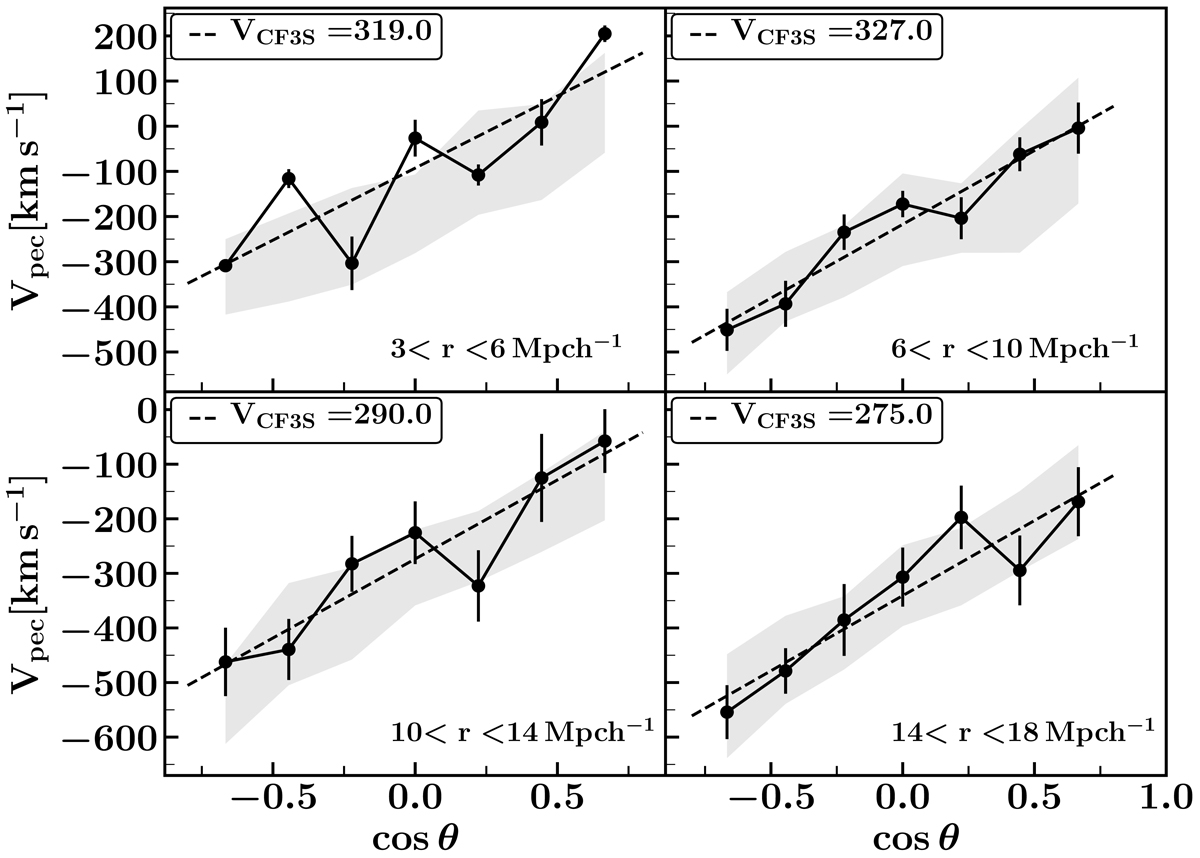
Mean peculiar velocity as a function of the angle between the galaxy-group and group-observer (θ) directions in the CF3S (points). Each panel corresponds to a different galaxy-group distance, as is indicated in the figure. The dashed line indicates the best linear fitting, the slope is associated to the infall amplitude (VCF3S) and it is specified in each panel. The error bars correspond to the peculiar velocity dispersion. The gray shaded areas enclose the dispersion of mean peculiar velocity from the 25 biased mock catalogs. We note that the range of the y-axis in upper and lower panels is different.
Current usage metrics show cumulative count of Article Views (full-text article views including HTML views, PDF and ePub downloads, according to the available data) and Abstracts Views on Vision4Press platform.
Data correspond to usage on the plateform after 2015. The current usage metrics is available 48-96 hours after online publication and is updated daily on week days.
Initial download of the metrics may take a while.