Fig. 3.
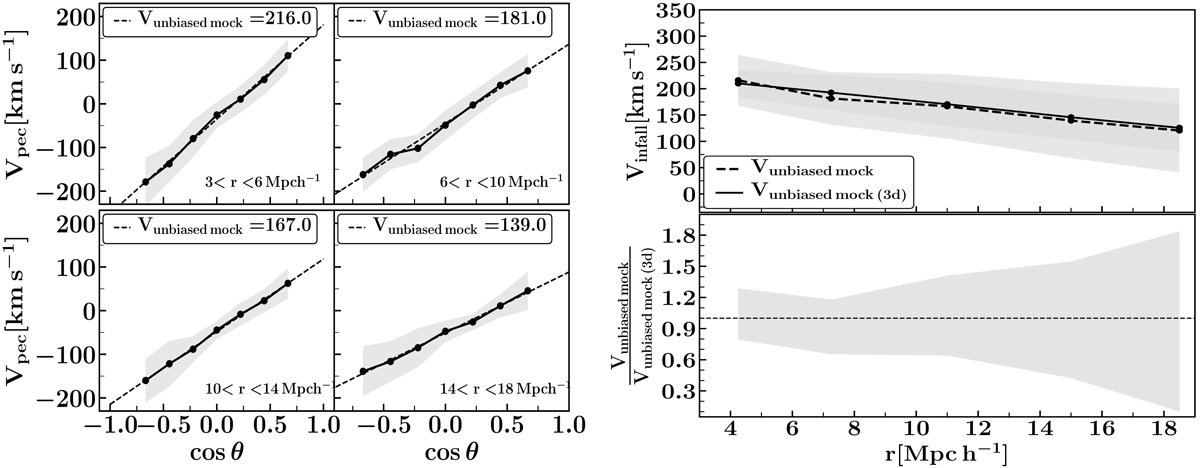
Left figure: mean peculiar velocity as a function of the angle the galaxy-group and group-observer directions (Θ) in the unbiased mock catalogs. Each panel corresponds to a different galaxy-group distance, as is indicated in the figure. The dashed line indicates the best linear fitting, the slope is associated with the infall amplitude (Vunbiased mock) and it is specified in each panel. The gray region corresponds to the peculiar velocity dispersion. Right figure, upper panel: mean infall velocity as a function of distance to the group center in the unbiased mock catalogs. The solid line indicates the mean velocity directly obtained from the three-dimensional peculiar velocity (Vunbiased mock (3d)). Dashed line corresponds to the infall amplitude (Vunbiased mock) obtained by applying our statistical method at LoS peculiar velocities and coincides with the slopes of the lines in the left figure. The displayed velocities are averaged over 25 unbiased mock catalogs and the shadow region shows their dispersion. Right figure, lower panel: dispersion of the ratio between the mean infall velocities (Vunbiased mock (3d)) and the mean infall (Vunbiased mock) velocities for each unbiased mock.
Current usage metrics show cumulative count of Article Views (full-text article views including HTML views, PDF and ePub downloads, according to the available data) and Abstracts Views on Vision4Press platform.
Data correspond to usage on the plateform after 2015. The current usage metrics is available 48-96 hours after online publication and is updated daily on week days.
Initial download of the metrics may take a while.