Fig. 2.
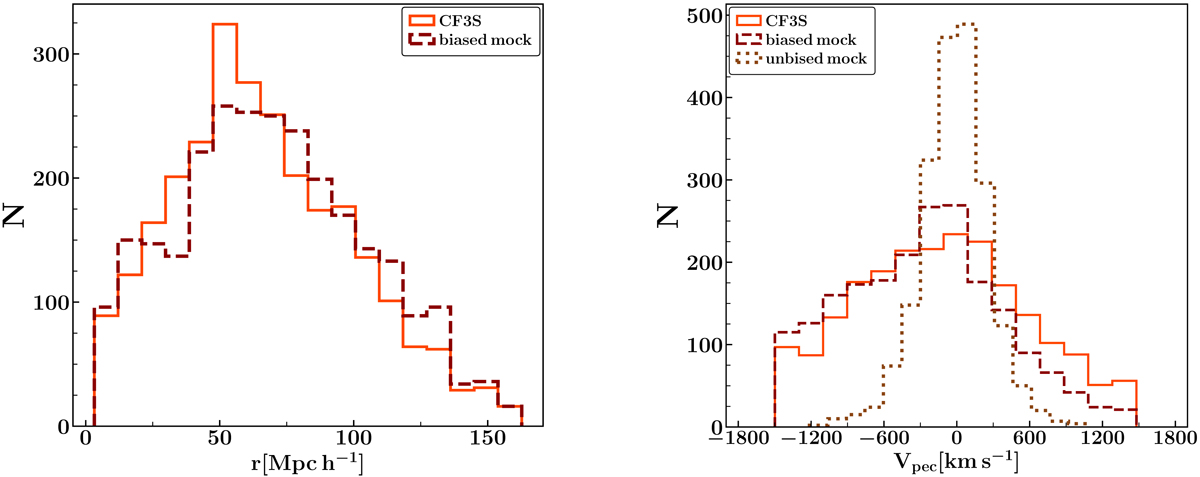
Left panel: distributions of distances in CF3S (solid orange line) and in a typical mock catalog with distance errors included (biased mock, dashed brown line). Right panel: distribution of radial peculiar velocities in CF3S (solid line histogram) and in the biased mock catalog (dashed histogram). A large tail toward negative values is observed in both distributions. The distribution associated to the mock catalog without errors (unbiased mock, dotted brown line histogram) has a nearly Gaussian radial peculiar velocity distribution.
Current usage metrics show cumulative count of Article Views (full-text article views including HTML views, PDF and ePub downloads, according to the available data) and Abstracts Views on Vision4Press platform.
Data correspond to usage on the plateform after 2015. The current usage metrics is available 48-96 hours after online publication and is updated daily on week days.
Initial download of the metrics may take a while.