Fig. 11.
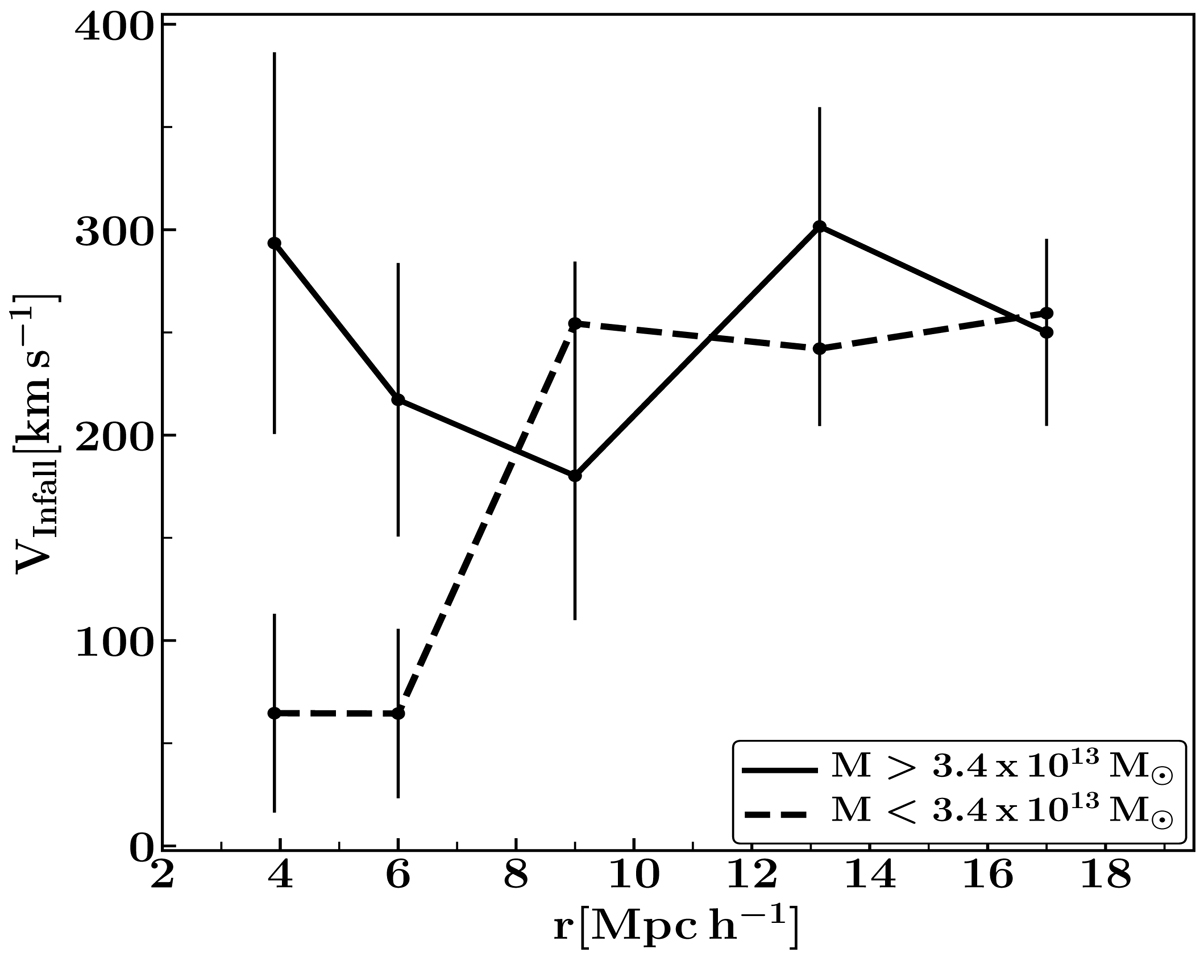
Infall dependence on group mass in the observational data. The group subsamples are restricted to reside in similar density environments (1 < δρe < 2.5). The solid (shaded) line corresponds to high- (low-) mass groups with M larger (smaller) than Mmedian. Error bars represent the uncertainty in the derived mean infalling velocities.
Current usage metrics show cumulative count of Article Views (full-text article views including HTML views, PDF and ePub downloads, according to the available data) and Abstracts Views on Vision4Press platform.
Data correspond to usage on the plateform after 2015. The current usage metrics is available 48-96 hours after online publication and is updated daily on week days.
Initial download of the metrics may take a while.