Fig. 7.
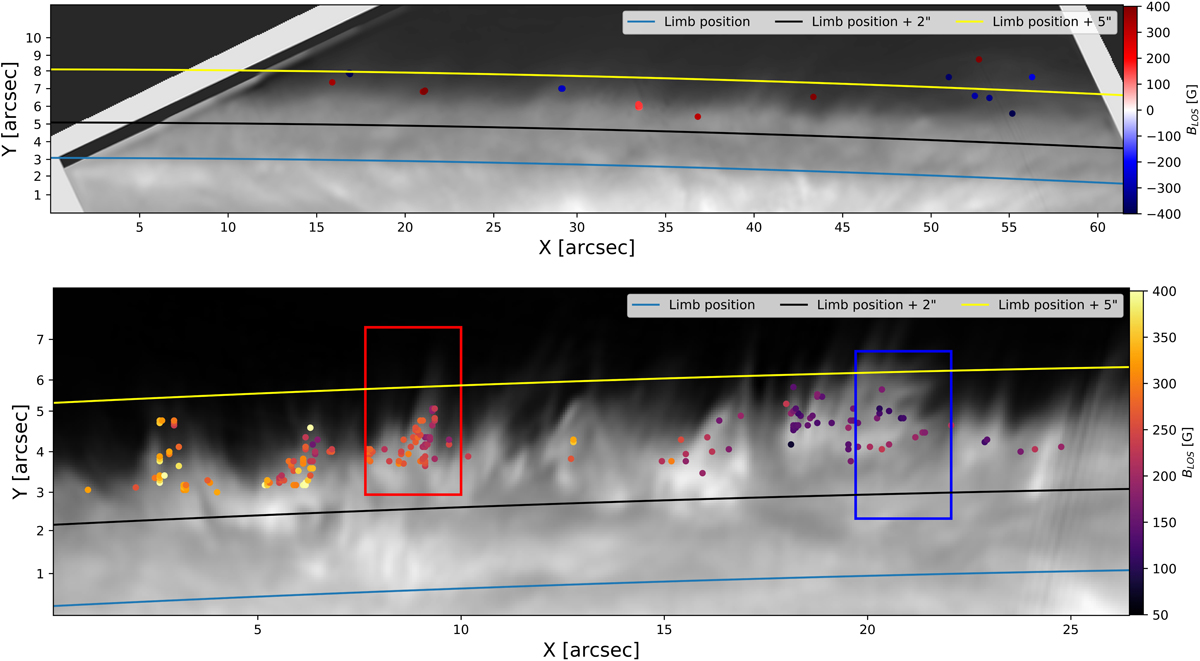
Results from the Bayesian inference for the off-limb data of 02 June 2016 at 07:46:06 UT, belonging to data set 1 (top frame), and 03 June 2016 at 16:43:20 UT, belonging to data set 8 (bottom frame). The points are coloured based on the mode from the posterior distribution of the LOS magnetic field intensity (see colour bar at the right) and are plotted on top of the Ca II 8542 Å line centre intensity image. The blue line represents the position of the solar limb, while the black and yellow curves represent the heights 2″ and 5″ above the limb, respectively. The red and blue rectangles in the bottom panel are used in Fig. 14.
Current usage metrics show cumulative count of Article Views (full-text article views including HTML views, PDF and ePub downloads, according to the available data) and Abstracts Views on Vision4Press platform.
Data correspond to usage on the plateform after 2015. The current usage metrics is available 48-96 hours after online publication and is updated daily on week days.
Initial download of the metrics may take a while.