Fig. 14.
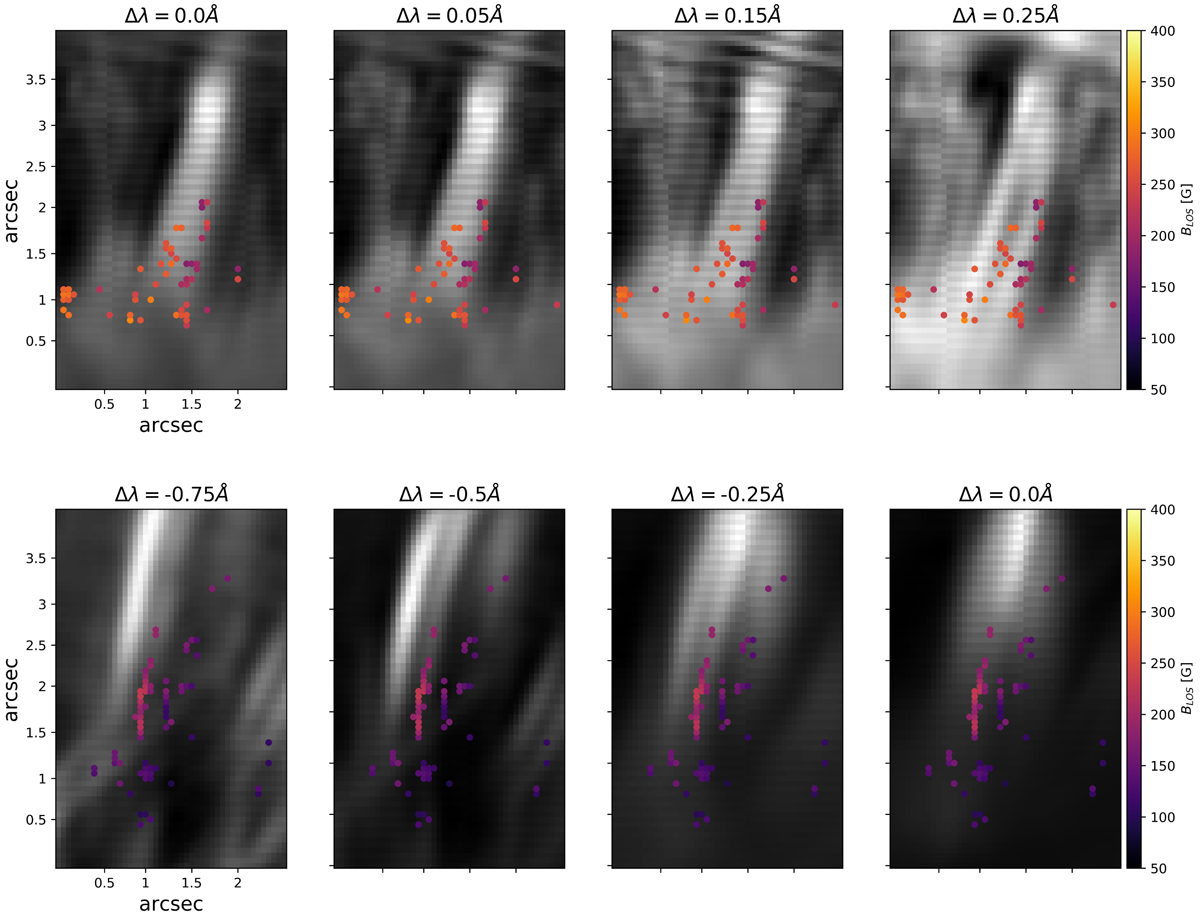
Line-of-sight magnetic field results of the red (top) and blue (bottom) rectangles of the bottom panel of Fig. 7 are overplotted on top of Stokes I at 16:42:44 UT and 17:03:55 UT for the top and bottom panels. The wavelength difference, Δλ, from line centre is shown at the top of each panel. A radial filter (see Skogsrud et al. 2015) has been applied to the images to enhance spicular structures.
Current usage metrics show cumulative count of Article Views (full-text article views including HTML views, PDF and ePub downloads, according to the available data) and Abstracts Views on Vision4Press platform.
Data correspond to usage on the plateform after 2015. The current usage metrics is available 48-96 hours after online publication and is updated daily on week days.
Initial download of the metrics may take a while.