Fig. 13.
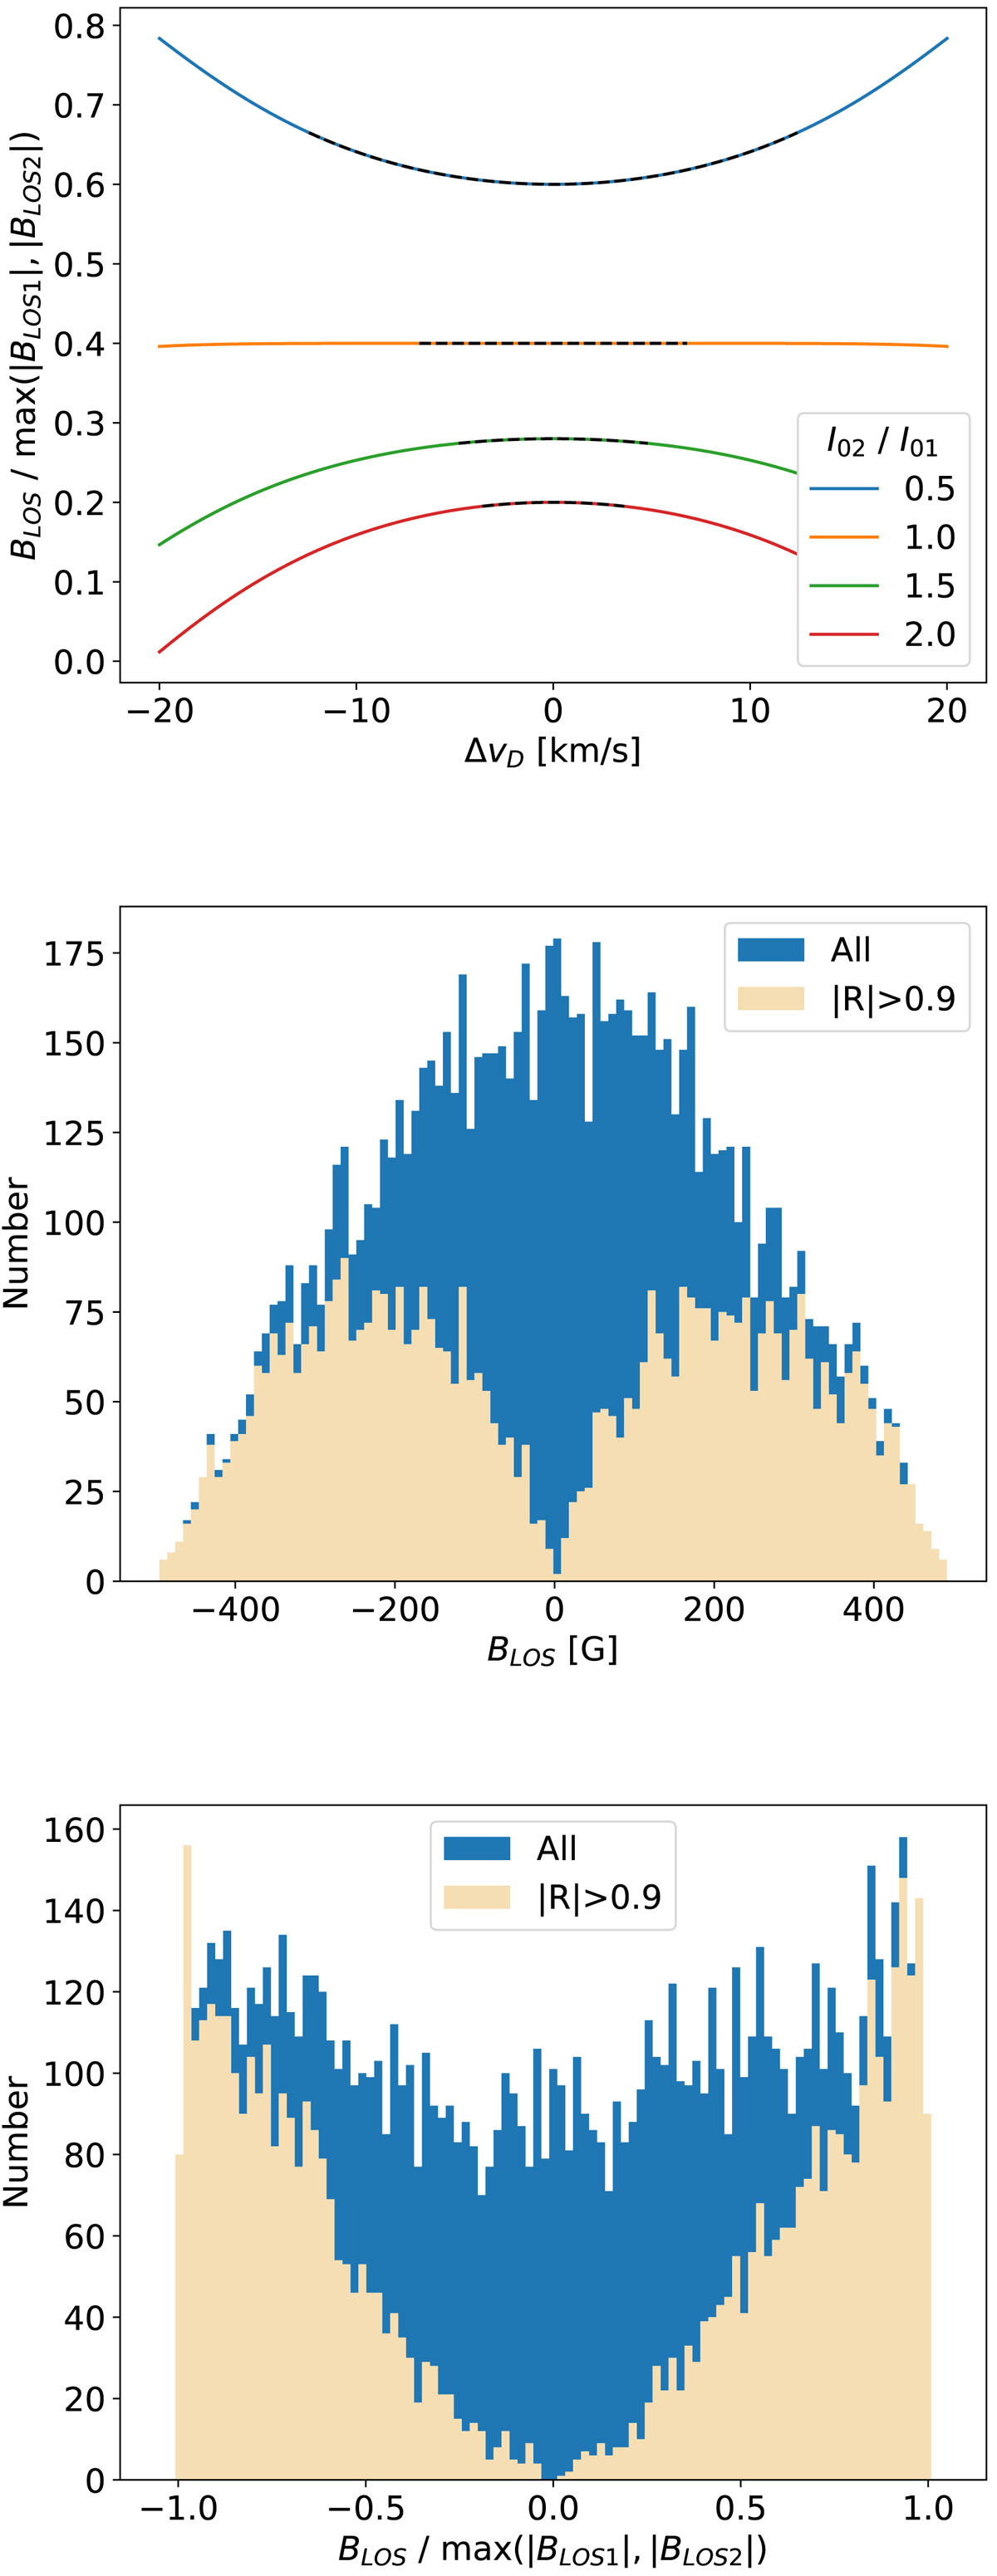
Results of the WFA BLOS inversion when the Stokes I and V parameters in a pixel come from two overlapping structures (cf. Eqs. (10) and (11)). Top: BLOS normalised by dividing it by the maximum LOS magnetic field of the two structures, in absolute value. It is plotted vs. the difference between the two slabs’ Doppler velocity, ΔvD, for several intensity amplitude ratios, I02/I01. The dashed black lines give the results for which |R| > 0.9. In this plot BLOS1 = 200 G and BLOS2 = −40 G. Middle: BLOS distribution from the Monte Carlo experiment. Bottom: BLOS distribution divided by the maximum of |BLOS1|,|BLOS2|. In the middle and bottom panels, the blue and beige colours respectively correspond to all the samples in the Monte Carlo experiment and only those that pass the filter |R| > 0.9.
Current usage metrics show cumulative count of Article Views (full-text article views including HTML views, PDF and ePub downloads, according to the available data) and Abstracts Views on Vision4Press platform.
Data correspond to usage on the plateform after 2015. The current usage metrics is available 48-96 hours after online publication and is updated daily on week days.
Initial download of the metrics may take a while.