Free Access
Fig. 12.
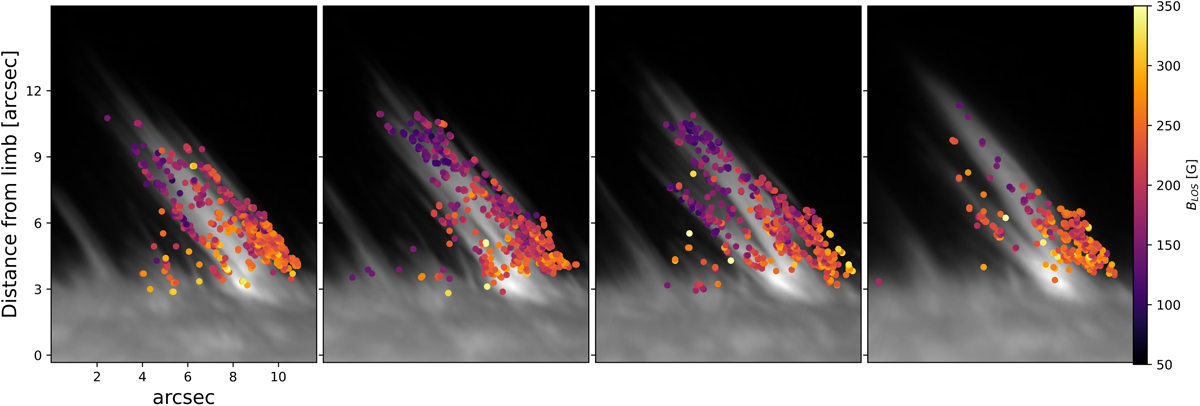
Temporal evolution of the chromospheric anemone seen in Fig. 11 and the inferred BLOS values. The leftmost picture was taken on 03 June 2016 at 16:31:50 UT and the subsequent figures show the evolution of the region and the inferred BLOS at time intervals of 36.33 s.
Current usage metrics show cumulative count of Article Views (full-text article views including HTML views, PDF and ePub downloads, according to the available data) and Abstracts Views on Vision4Press platform.
Data correspond to usage on the plateform after 2015. The current usage metrics is available 48-96 hours after online publication and is updated daily on week days.
Initial download of the metrics may take a while.