Fig. 1.
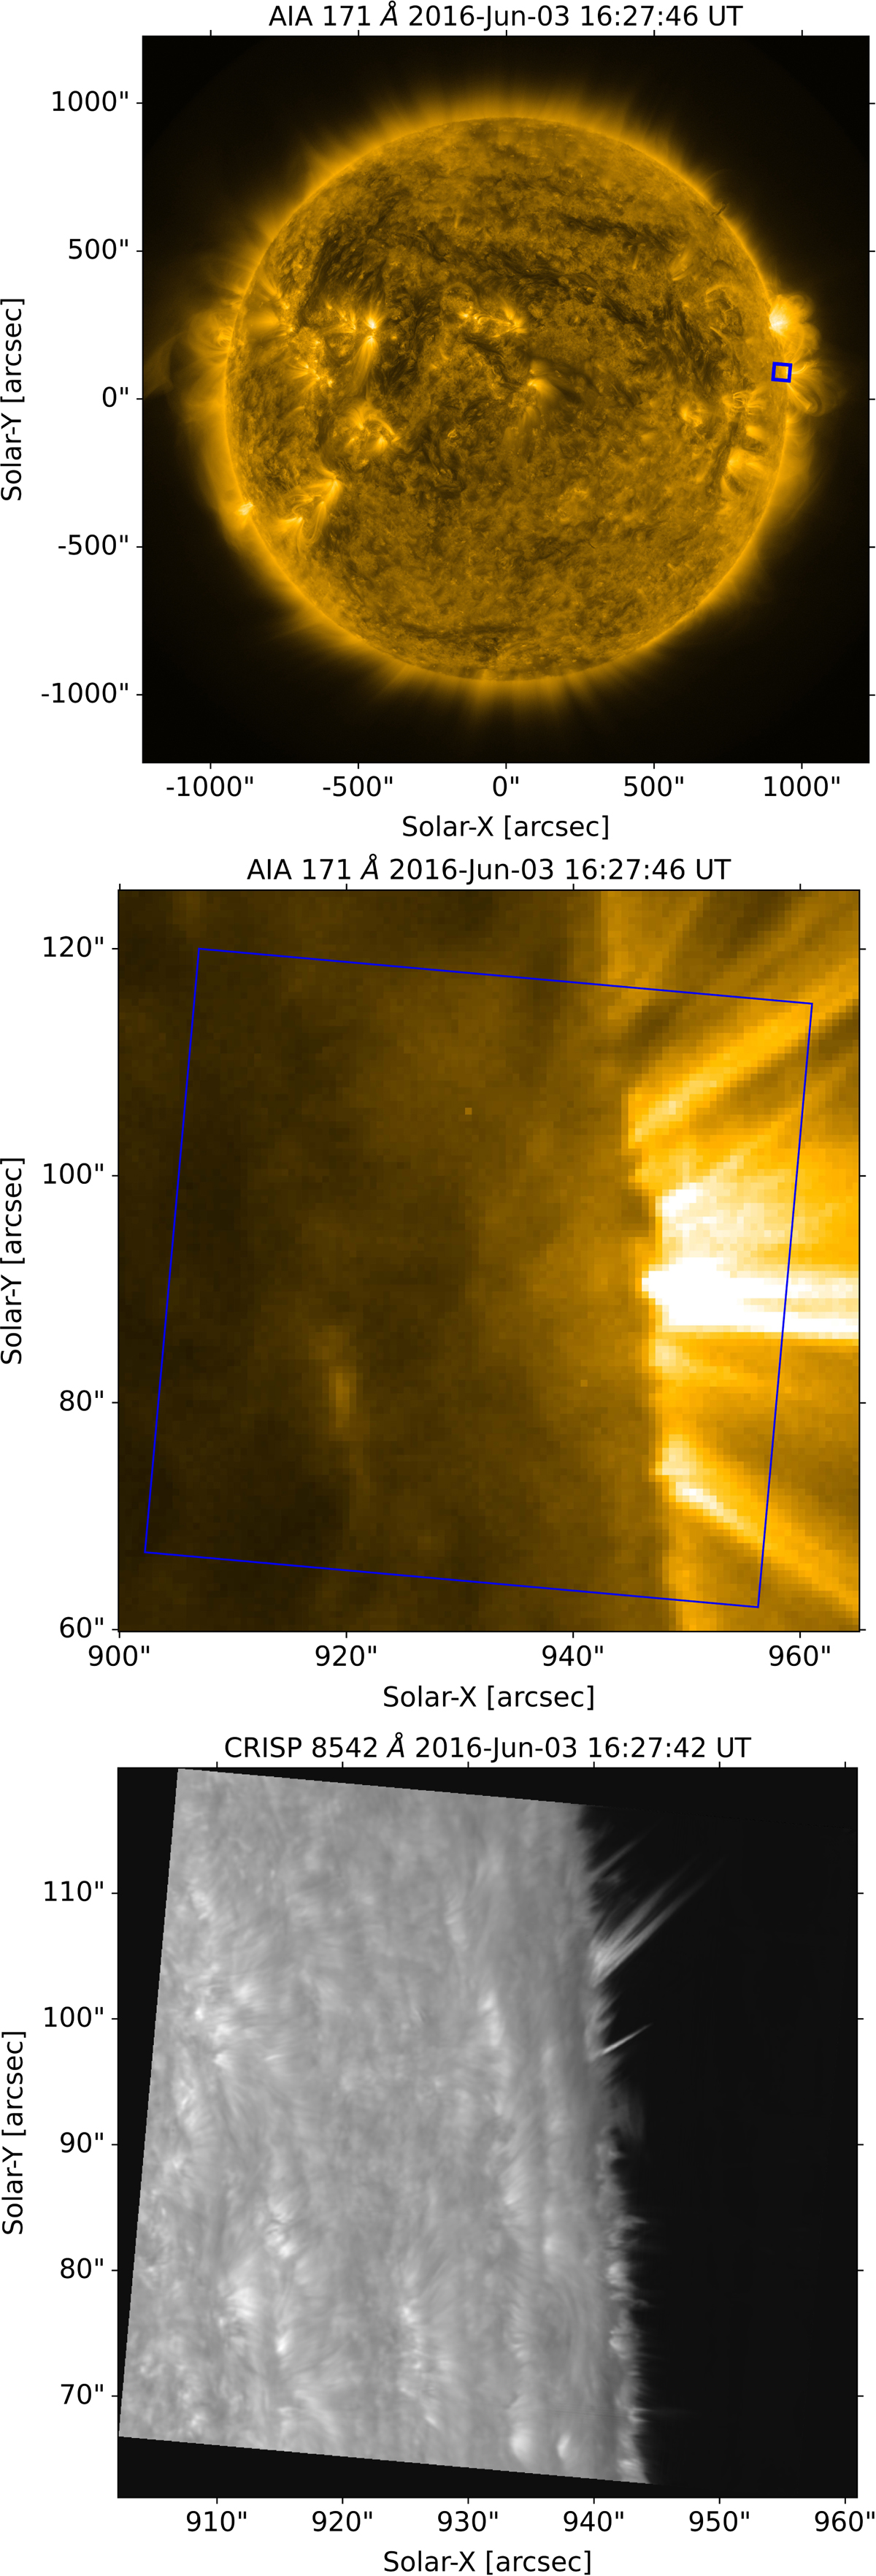
Context of the observations of 03 June 2016 at 16:27 UT. The top panel shows the CRISP field of view (blue square) on an SDO/AIA image in the 171 Å filter. The middle panel shows a zoomed view of the top panel. The bottom panel shows a nearly co-temporal SST/CRISP image in the line centre of the Ca II 8542 Å line. Time is shown at the top of each frame and solar north is to the top.
Current usage metrics show cumulative count of Article Views (full-text article views including HTML views, PDF and ePub downloads, according to the available data) and Abstracts Views on Vision4Press platform.
Data correspond to usage on the plateform after 2015. The current usage metrics is available 48-96 hours after online publication and is updated daily on week days.
Initial download of the metrics may take a while.