Free Access
Fig. 5
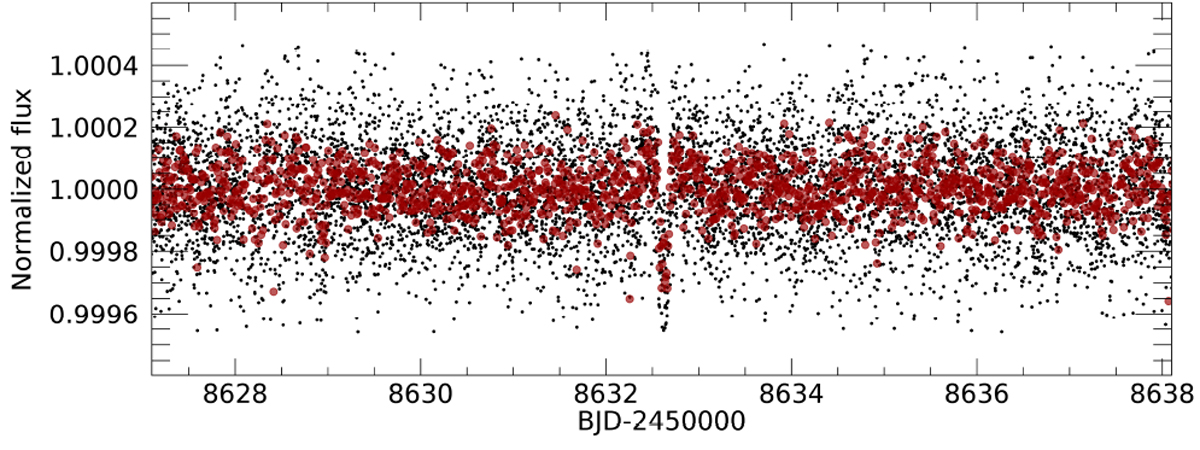
Portion of the TESS light curve centred around the predicted time of inferior conjunction of π Men b (± 5σ). Red dots represent averages of five-data point bins. The only visible transit signal is that of π Men c.
Current usage metrics show cumulative count of Article Views (full-text article views including HTML views, PDF and ePub downloads, according to the available data) and Abstracts Views on Vision4Press platform.
Data correspond to usage on the plateform after 2015. The current usage metrics is available 48-96 hours after online publication and is updated daily on week days.
Initial download of the metrics may take a while.