Fig. 3
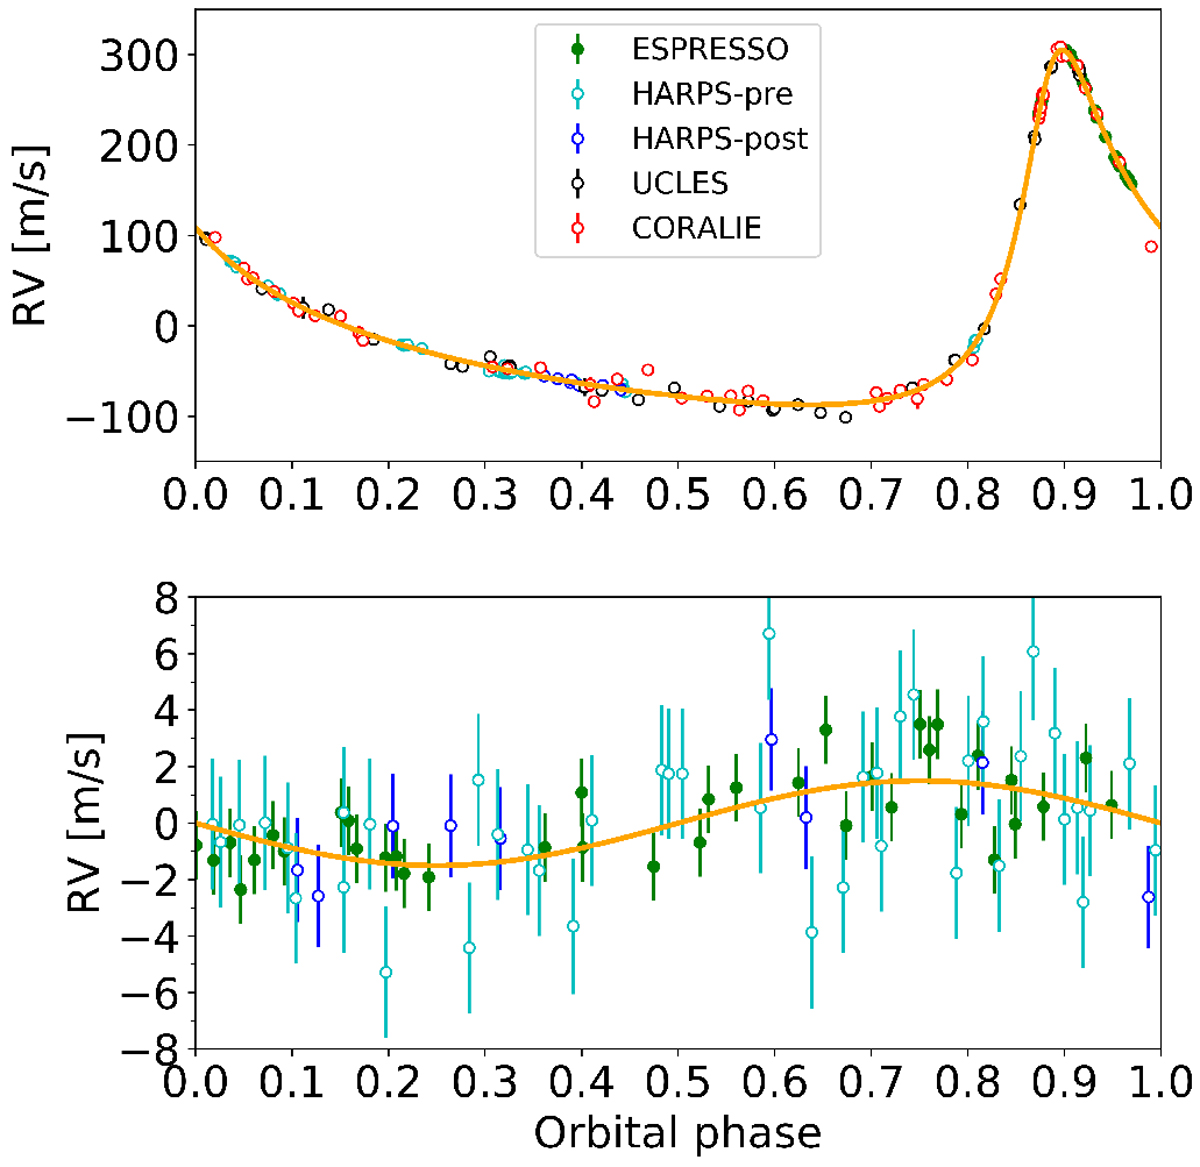
Spectroscopic orbits of the two planets in the π Men system (upper panel: π Men b; lower panel: π Men c; best-fit solutions in Table 3). The orange curve represents the best-fit model. For π Men c, we do not show the more scattered and less precise UCLES and CORALIE data for a bettervisualization, and the error bars include uncorrelated jitters added in quadrature to σRV.
Current usage metrics show cumulative count of Article Views (full-text article views including HTML views, PDF and ePub downloads, according to the available data) and Abstracts Views on Vision4Press platform.
Data correspond to usage on the plateform after 2015. The current usage metrics is available 48-96 hours after online publication and is updated daily on week days.
Initial download of the metrics may take a while.